

Boyd Shearer
Biography:
I've always had an obsession with public space and maps. Any new place I visit, my instinct is to discover my closest public parks. My published cartography focuses on favorite parks and wilderness areas.
My interests range from GPS mapping topographic features to video documentaries exploring historic city spaces. I've studied the development of large parks and forests in the historical context of economic exploitation of natural resources and changing ideas of scenic beauty and recreation. I've studied the genesis of urban park systems when Progressive Era ideas sculpted new programs for creative self-expression in city parks.
While exploring Kentucky's segregated history, I made an hour-long documentary exploring Kentucky's once-segregated black parks. Because of Jim Crow laws in the 1940s, Kentucky had cities with white-only and black-only park systems and even a black-only state resort park on Kentucky Lake. These parks remain a popular destination and space for annual cultural events.
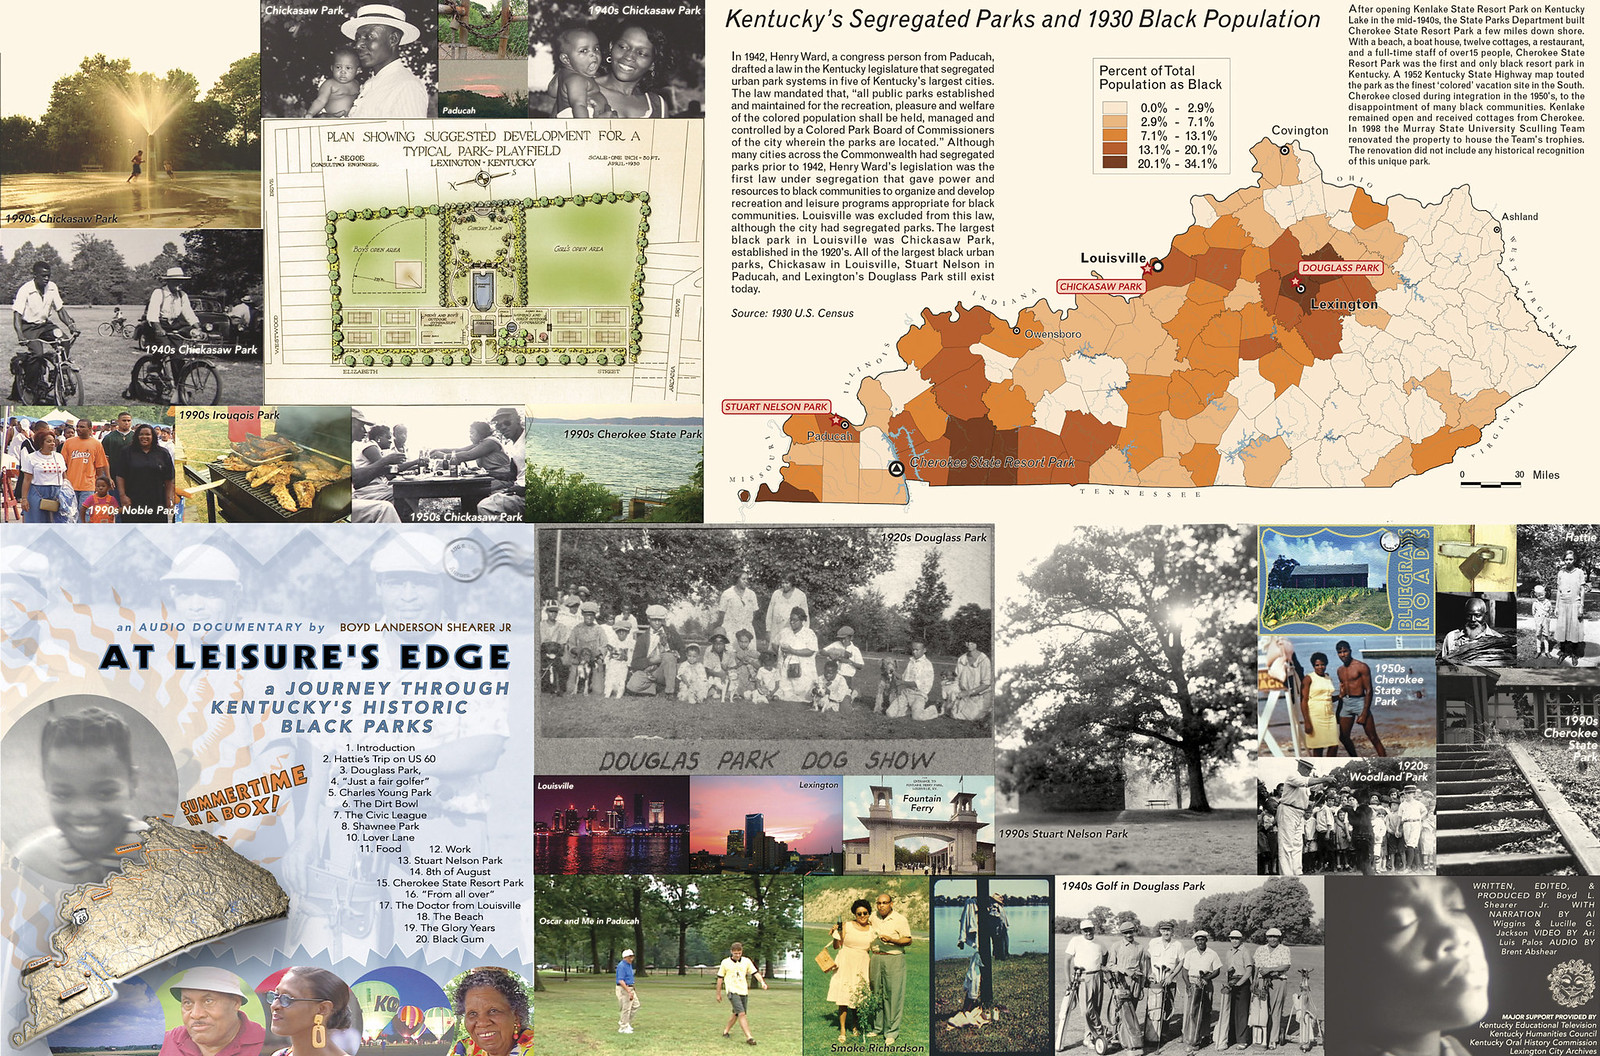
KET-funded documentary: At Leisure's Edge and its audio companion project
My current research focuses on one's experience in parks, especially while navigating. Strands of research evaluate trail-use difficulty through terrain modeling of lidar data and deriving a scenic landscape index based on an overlay analysis of multiple environmental layers. Being in the park, though, is the goal. In our digital lives, public parks, whether in the remote backcountry or leafy city parks, offer a discovery of an untethered self with only primitive technology to guide our way (until a cell tower is built nearby).
I teach courses in physical geography, cartography, and GIS.
Research Interests:
Cartography and Design
GIS and GPS
scenic landscape analysis
weather and climate
public parks
web mapping
lidar
Digital Twin
Presentations, labs, and maps
Sun & hill: topographic methods
Spring, 2025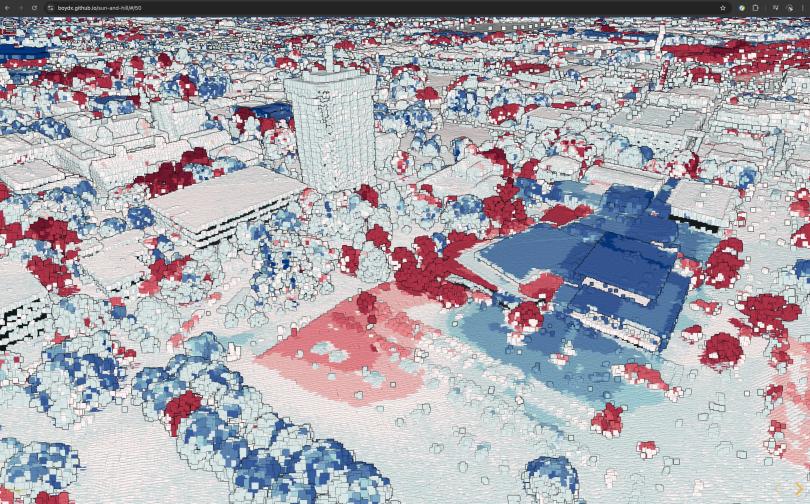
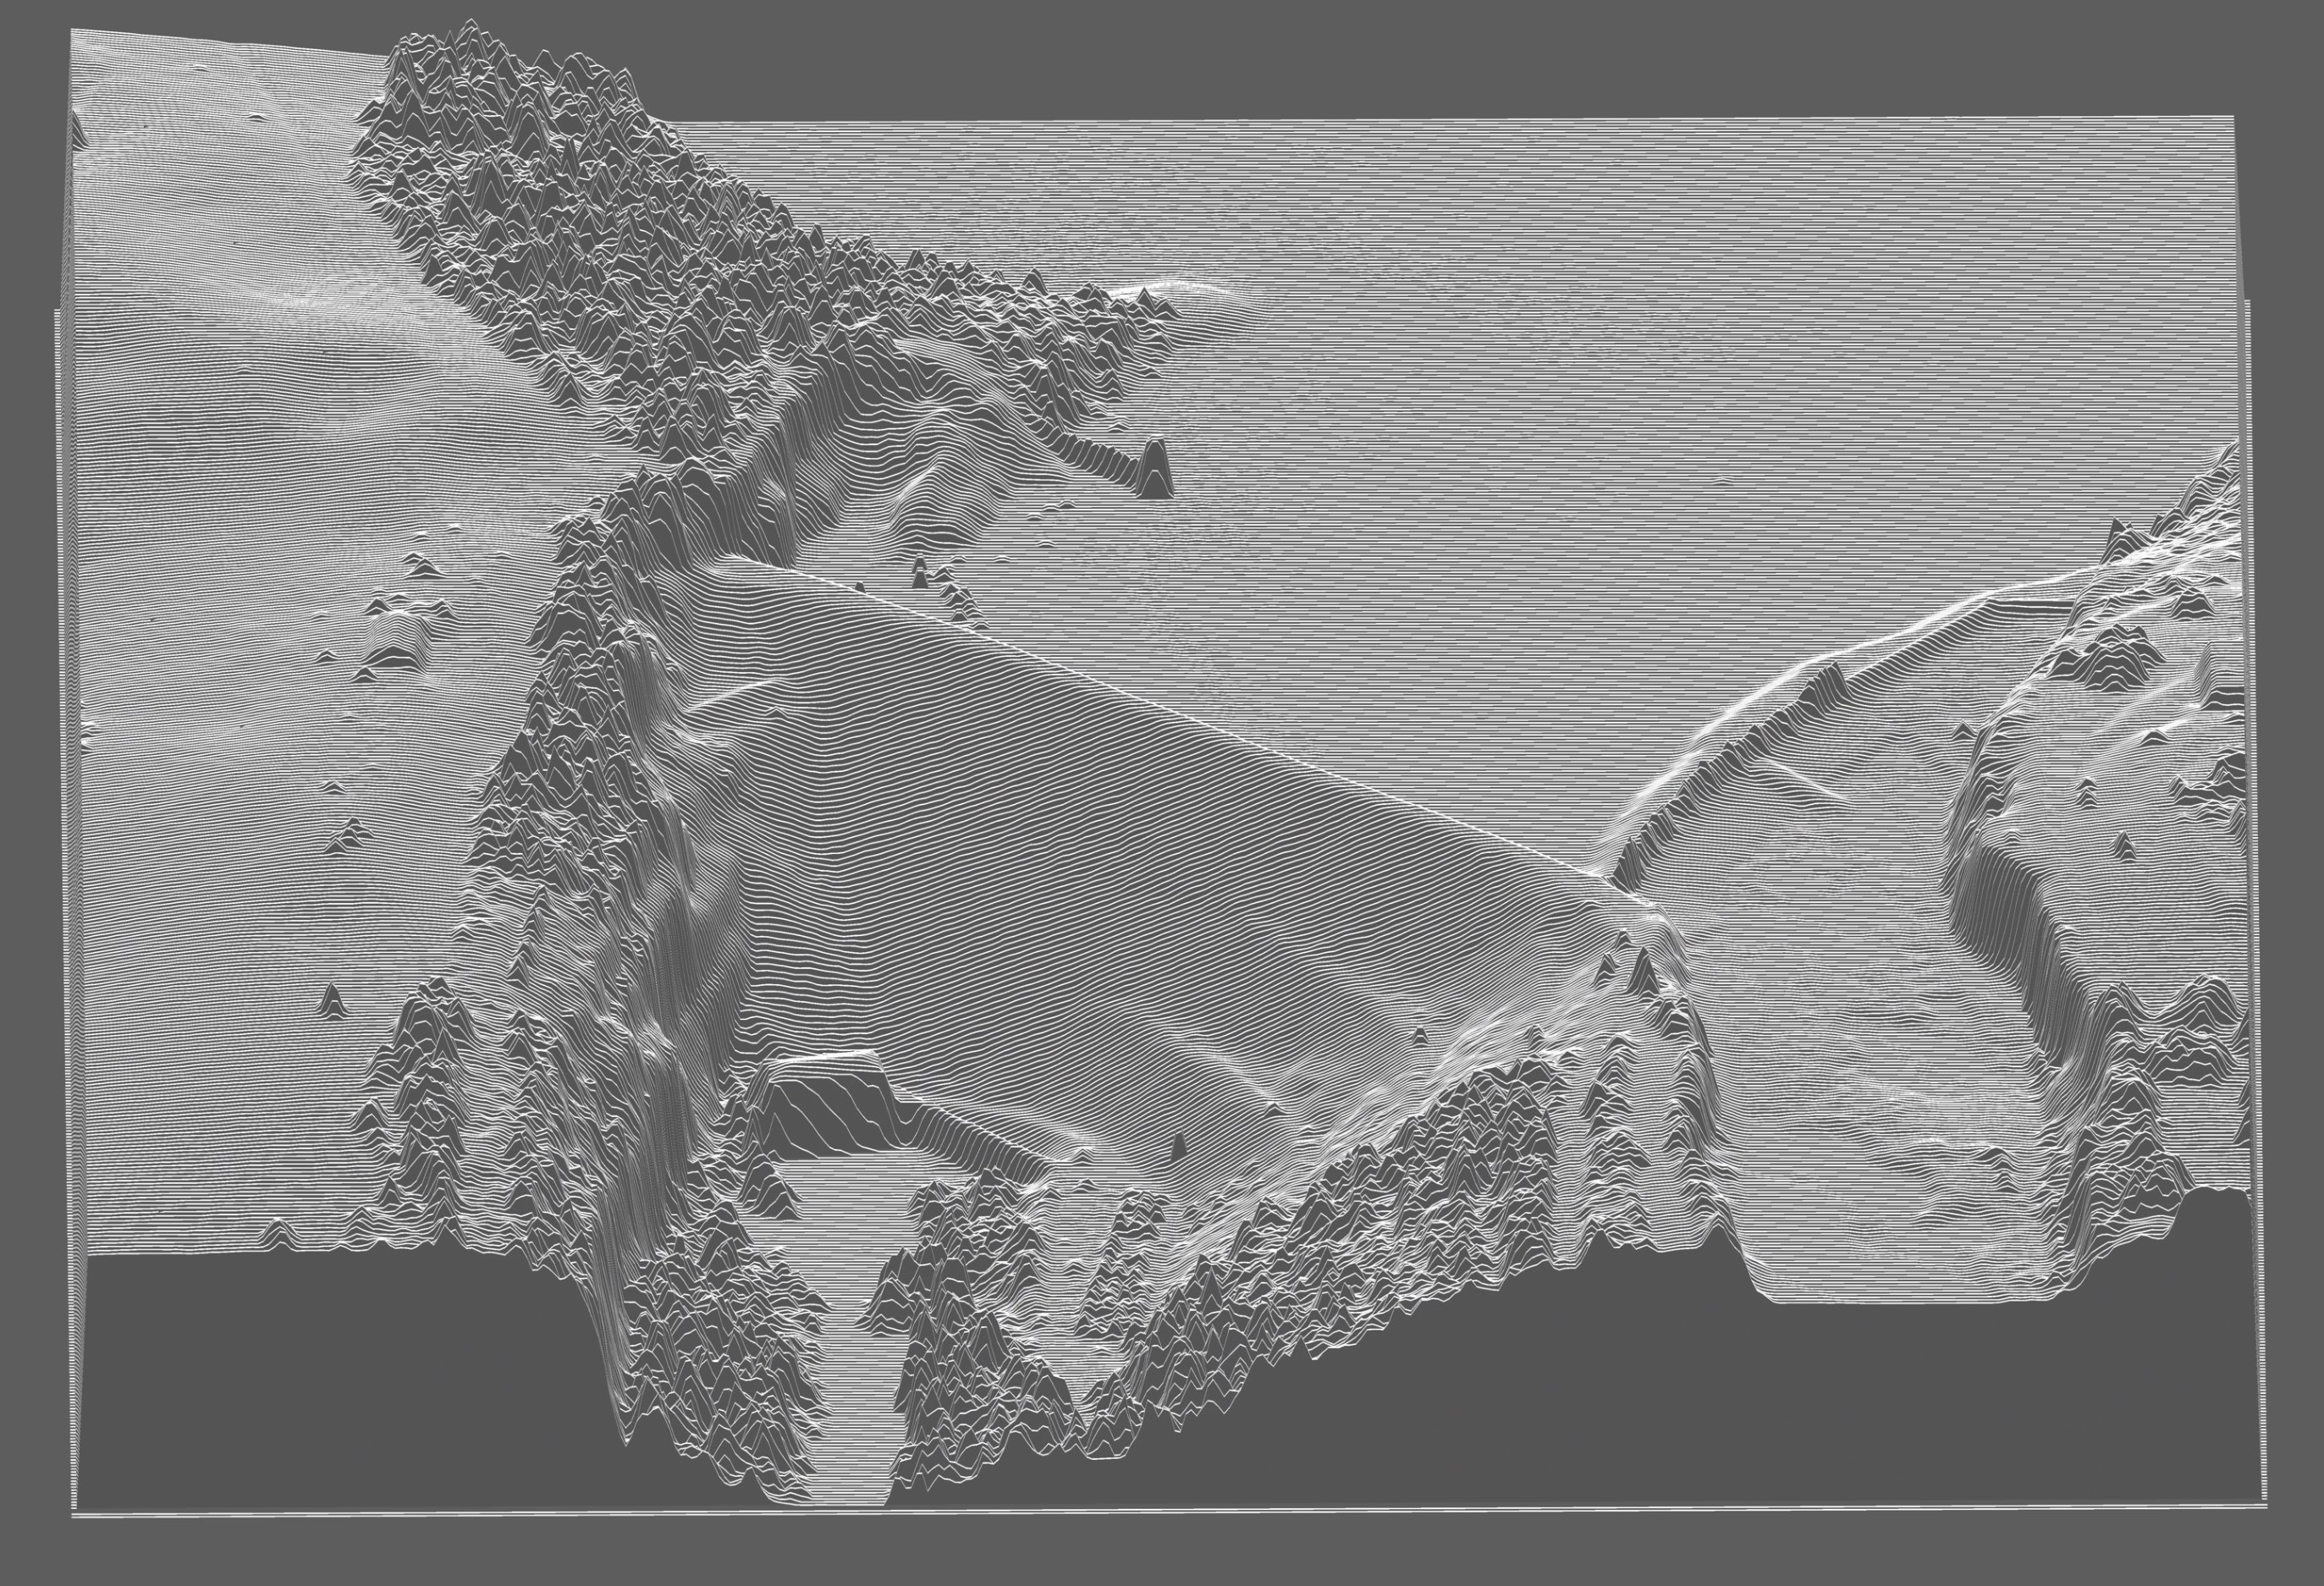
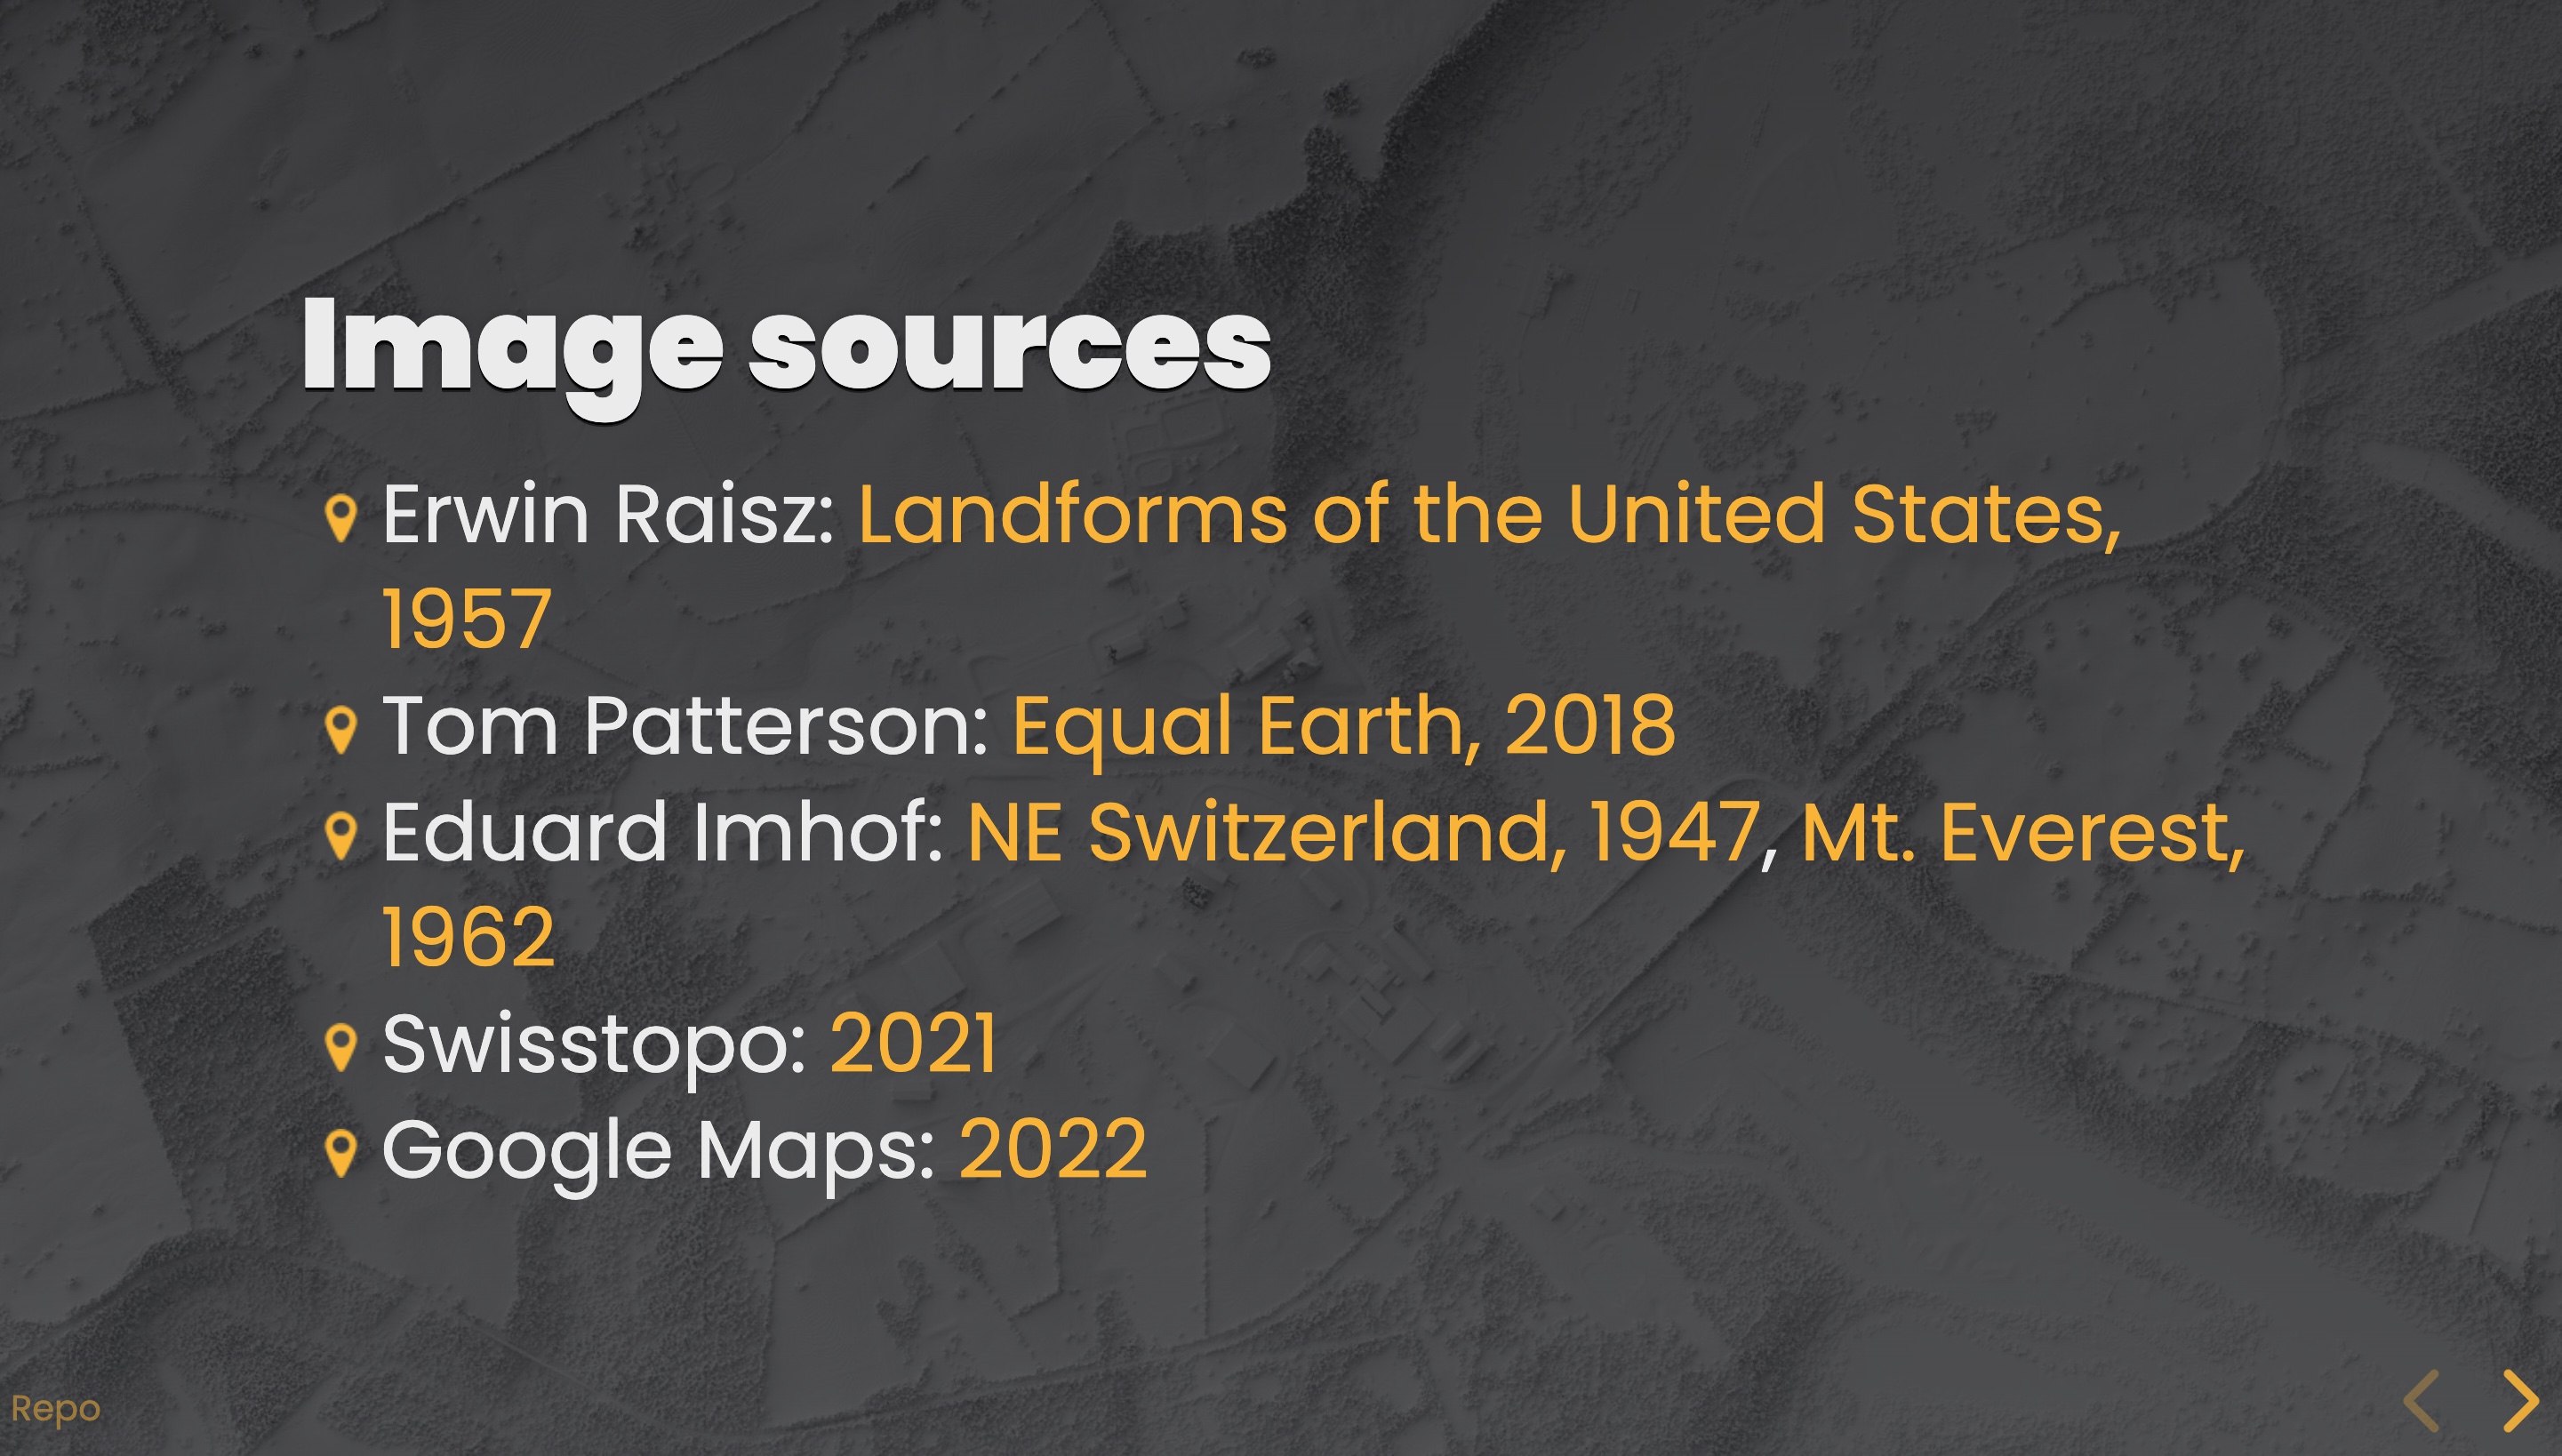
During the last century, advances in aviation and camera technology made topographic mapping with shaded reliefs and elevation contours a cornerstone of modern cartography. More recently, active remote sensing technology like LiDAR has decoupled the cartographer's need for sunlight and revolutionized our ability to observe and map places. This presentation explores the opportunities of LiDAR mapping and argues for a more nuanced understanding of topography, one that reflects the word's ancient Greek roots: 'topos' (place) and 'graphia' (writing) – literally, place writing. View presentation and code
Visualizing landscape dynamics
Fall, 2024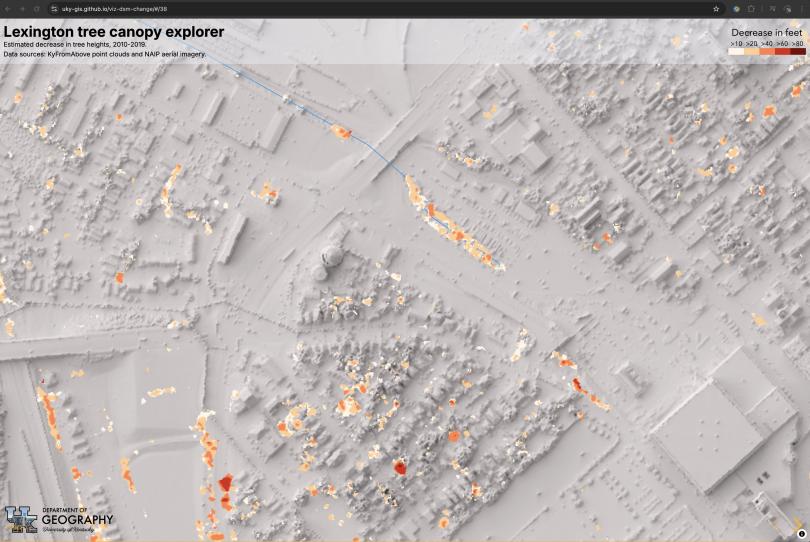
A presentation at 2024 Kentucky GIS Conference. This talk presents a unique approach to visualizing and quantifying above-ground surface changes using digital surface models (DSMs) derived from temporally distinct point clouds. View presentation and code
Open-source 3D maps in the browser
Fall, 2023
A presentation at 2023 Kentucky GIS Conference. This presentation explores the possibilities of using open-source mapping tools, specifically MapLibre GL JS, QGIS, and PMTiles, in combination with LiDAR point cloud elevation data to create dynamic and detailed 3D maps with terrain tile sets. View presentation and code.
GEO 409: Visualizing change
Spring semester, 2023
Lexington, Kentucky has two years of point cloud data; 2010 and 2019. Creating digital surface models (DSM) of both years, this map explores how to visualize the change in surface heights between the two years. Enlarge.
GEO 409: Visualizing point clouds
Spring semester, 2023
Visualizing lidar point clouds typically involves colorizing a cloud with aerial imagery taken near the same time as the lidar scan. This site explores this process and additional ways to visualize point clouds and their derivatives. Website and maps.
GEO 509: Report Fall 2022
Fall semester, 2022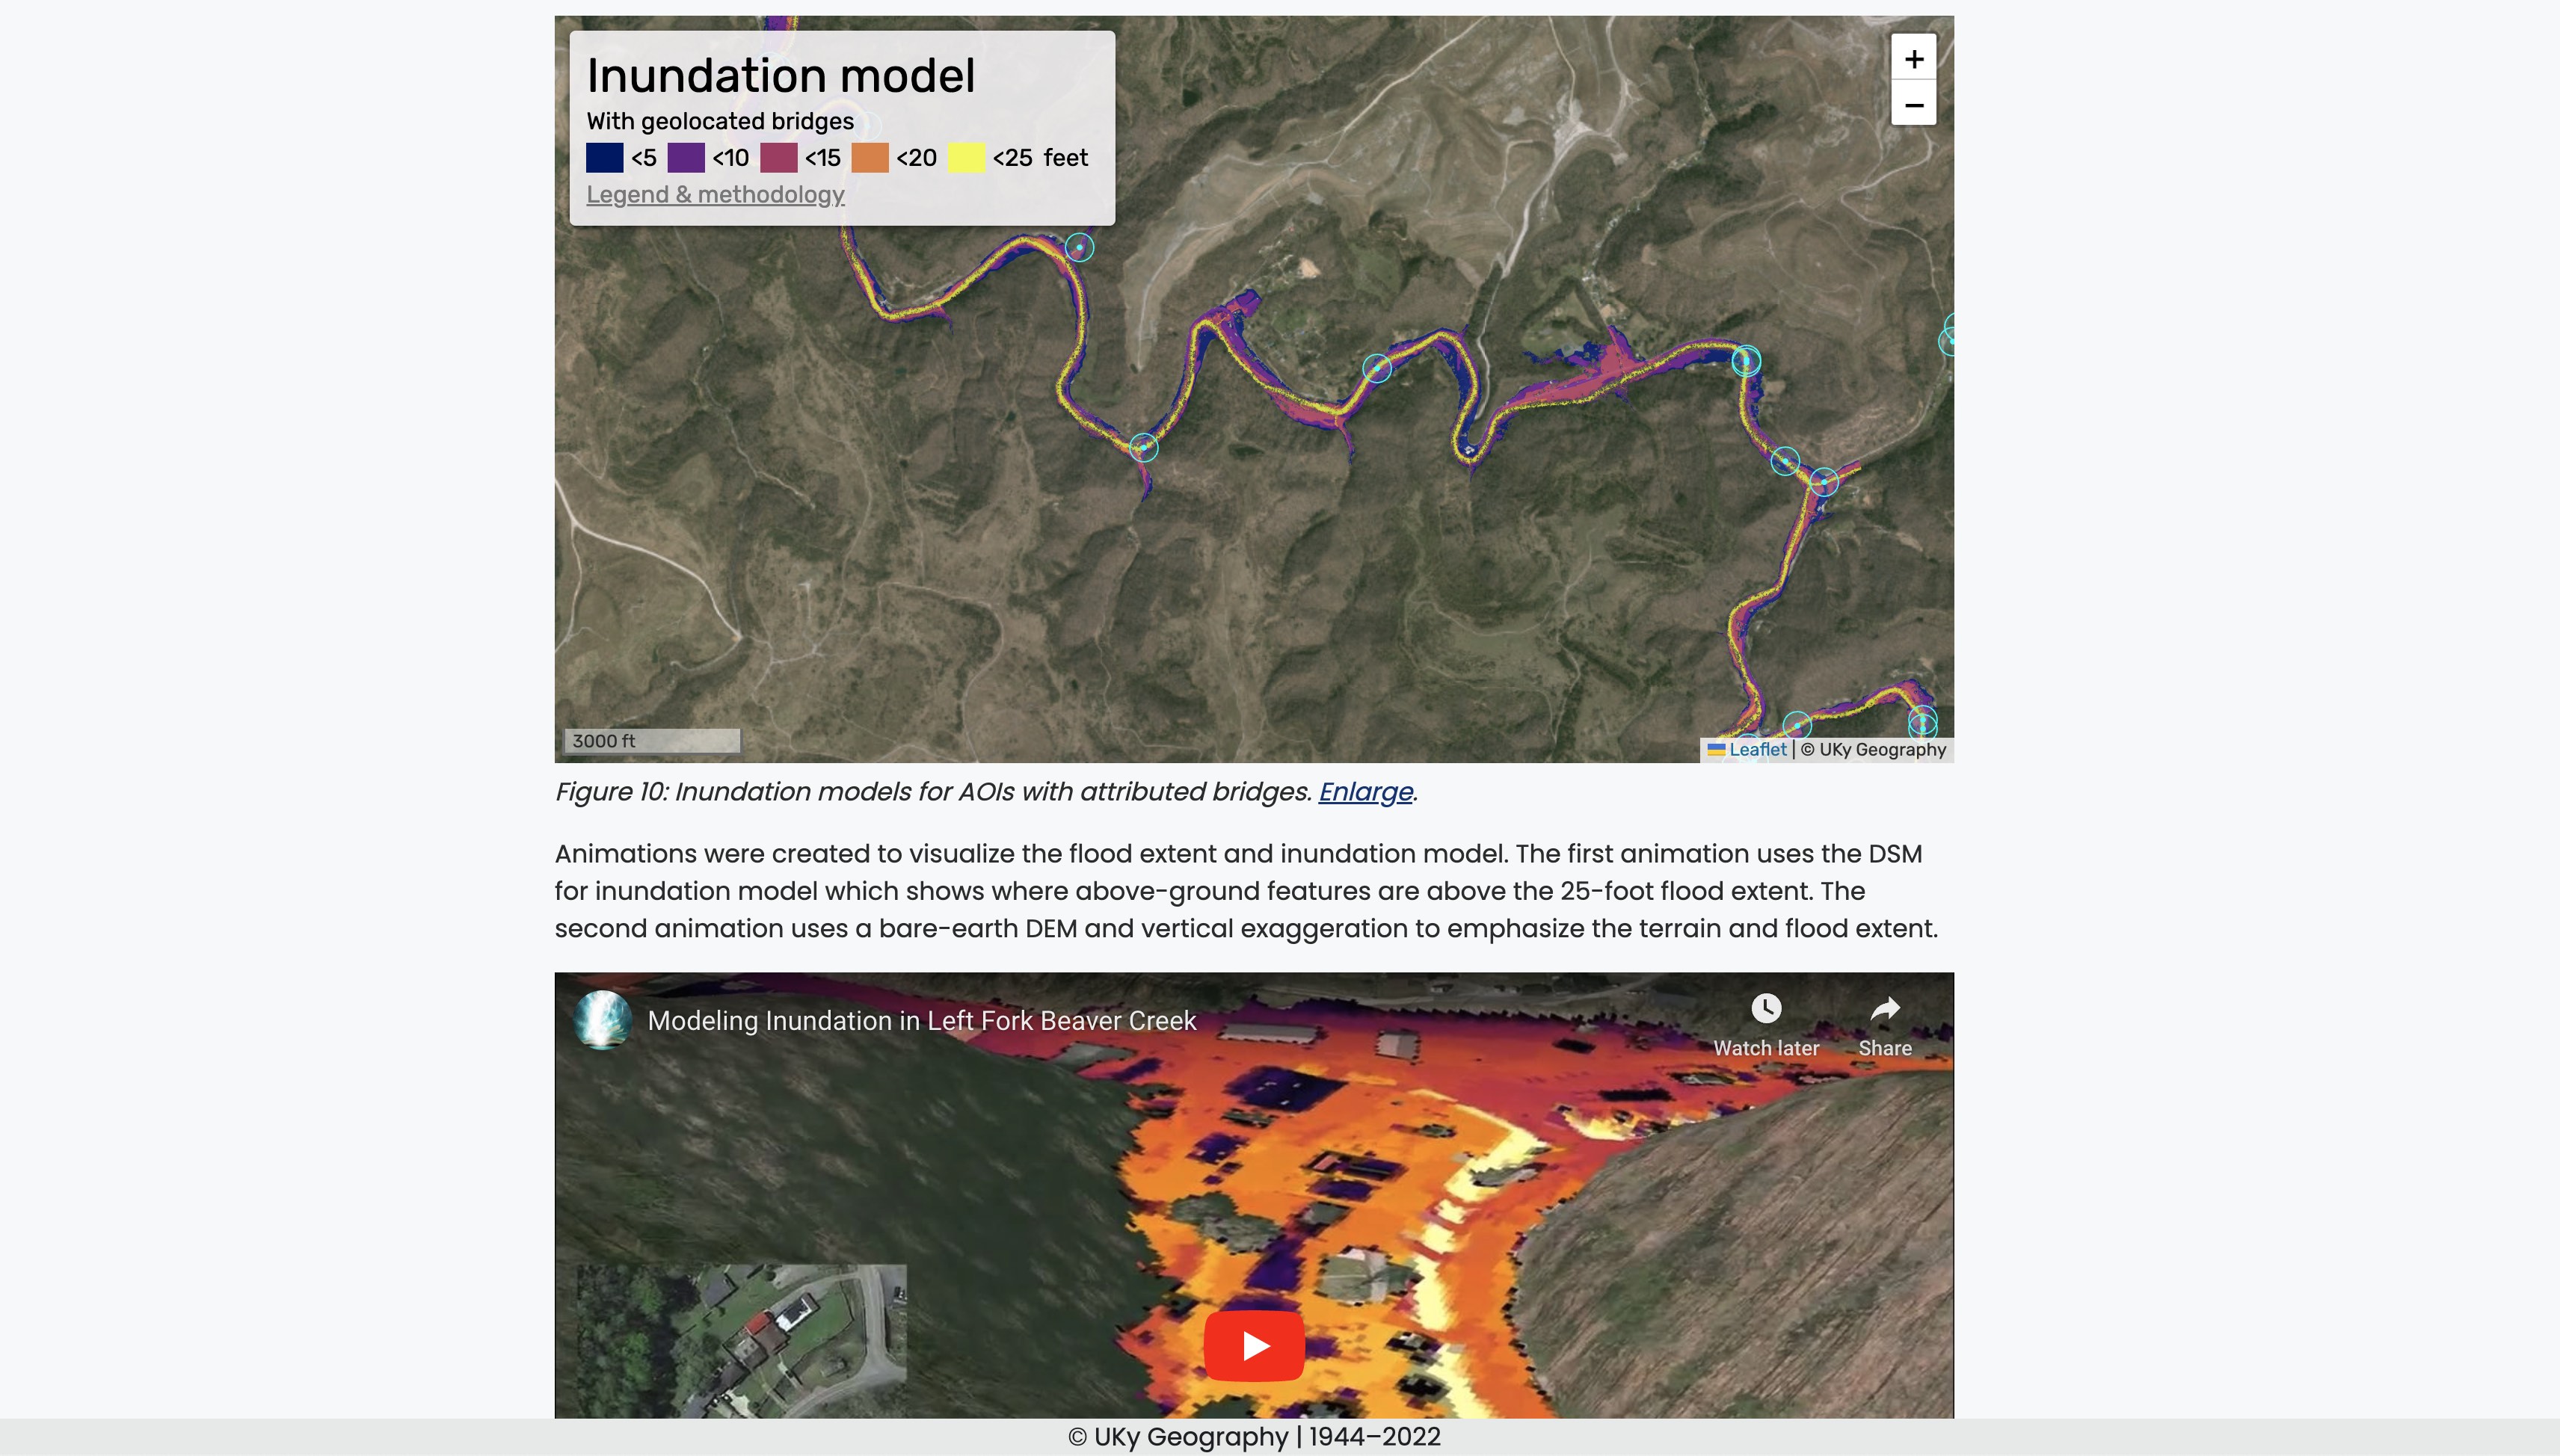
An analysis of flood-prone infrastructure and conditions in selected Eastern Kentucky watersheds. Website and maps.
Thinking of our Pauer Center for Cartography & GIS
Spring semester, 2022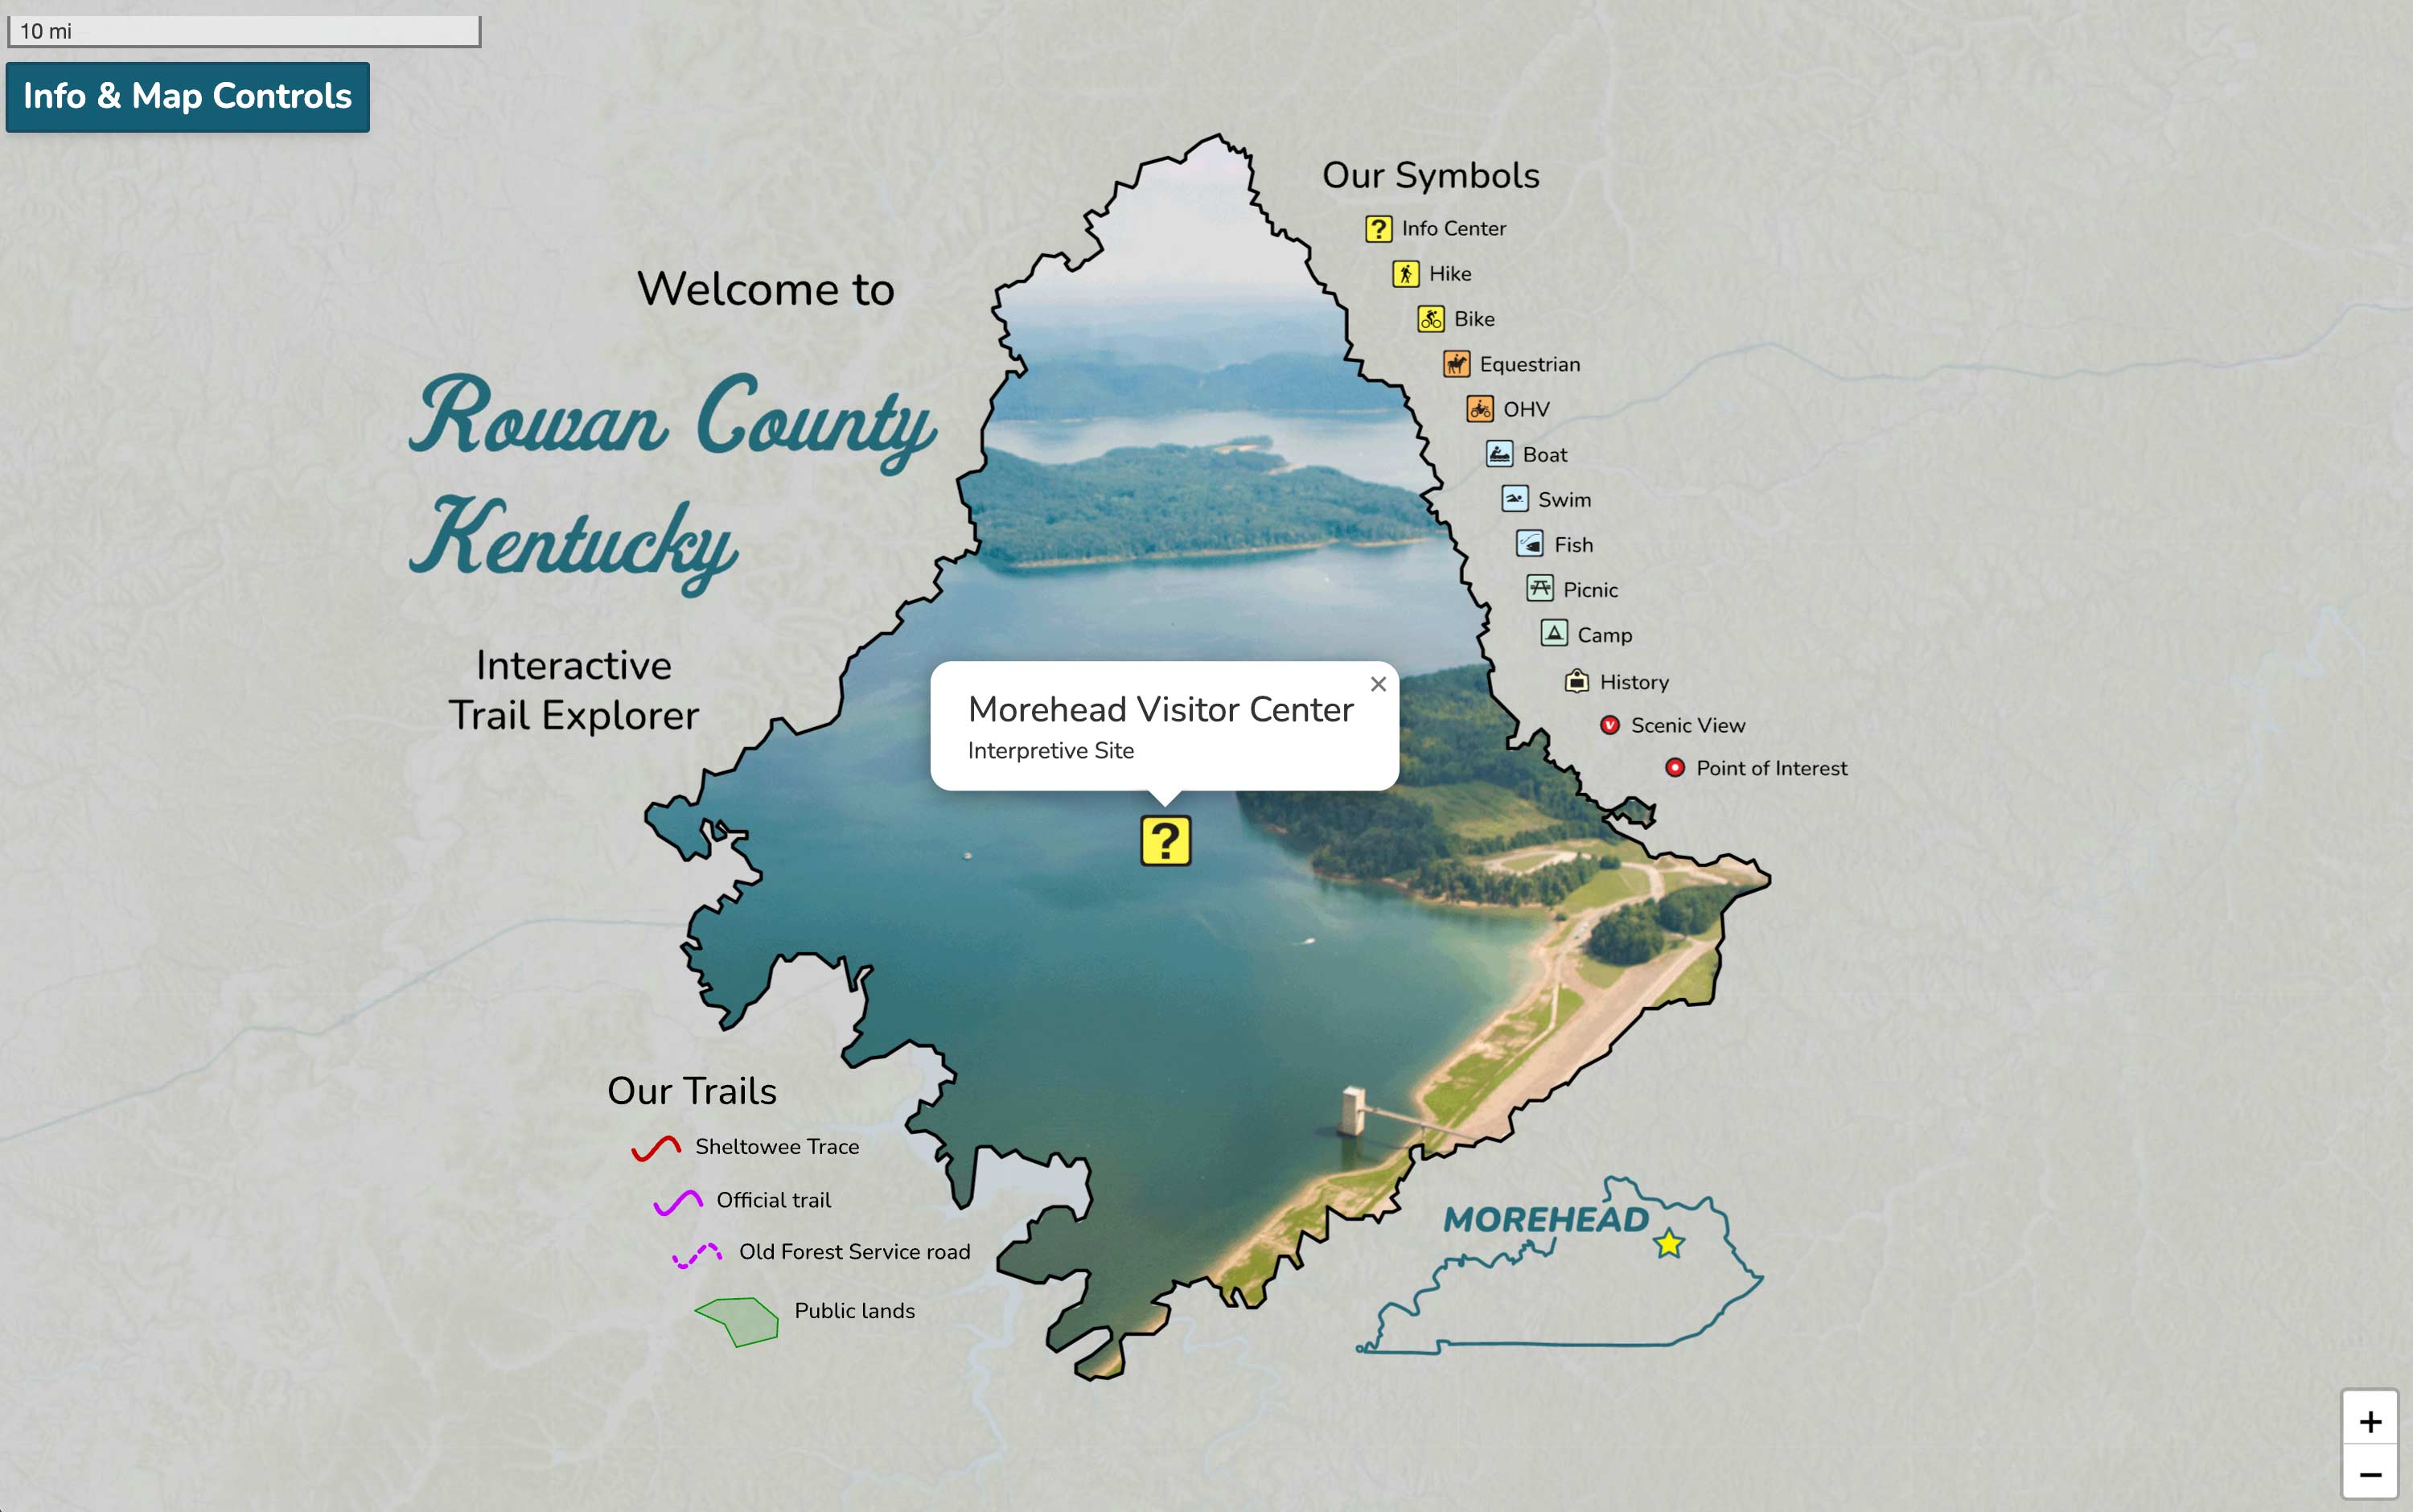
Over the years, non-profits and local governments have requested tourism maps. Many of our undergrads are from these same areas. A goal of mine is to orient our center to support and sustain a geography internship to produce creative and useful maps for these requests. View interactive map.
Shaded relief of Digital Surface Model
Spring semester, 2021
Lidar point clouds contain above-ground features. A DSM made with these features was shaded in Blender 3D software and converted to a raster tileset. View slippy map.
Go See Trees
Fall semester, 2020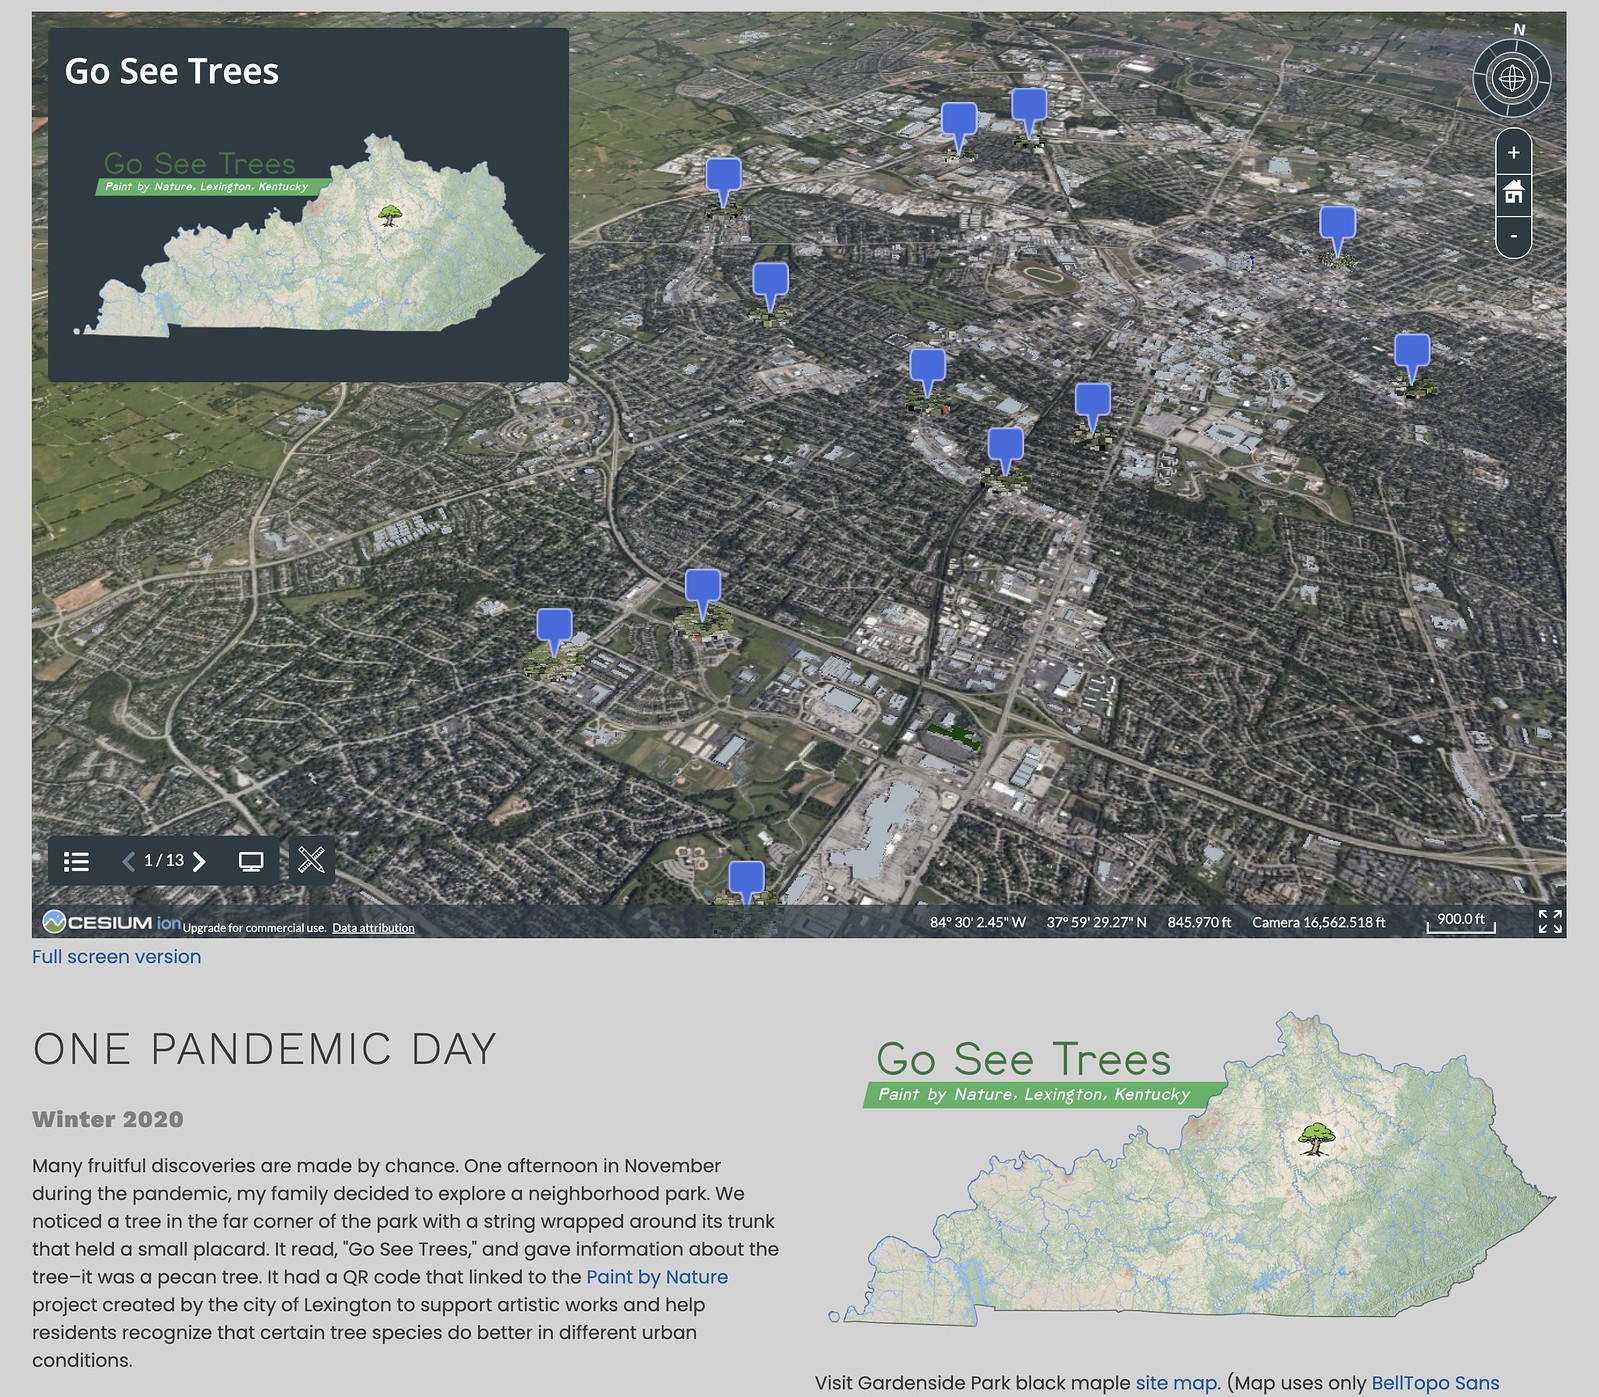
Paint by Nature in Lexington (pandemic project) boydx.github.io/go-see-trees/
Town Branch Corridor
Spring semester, 2021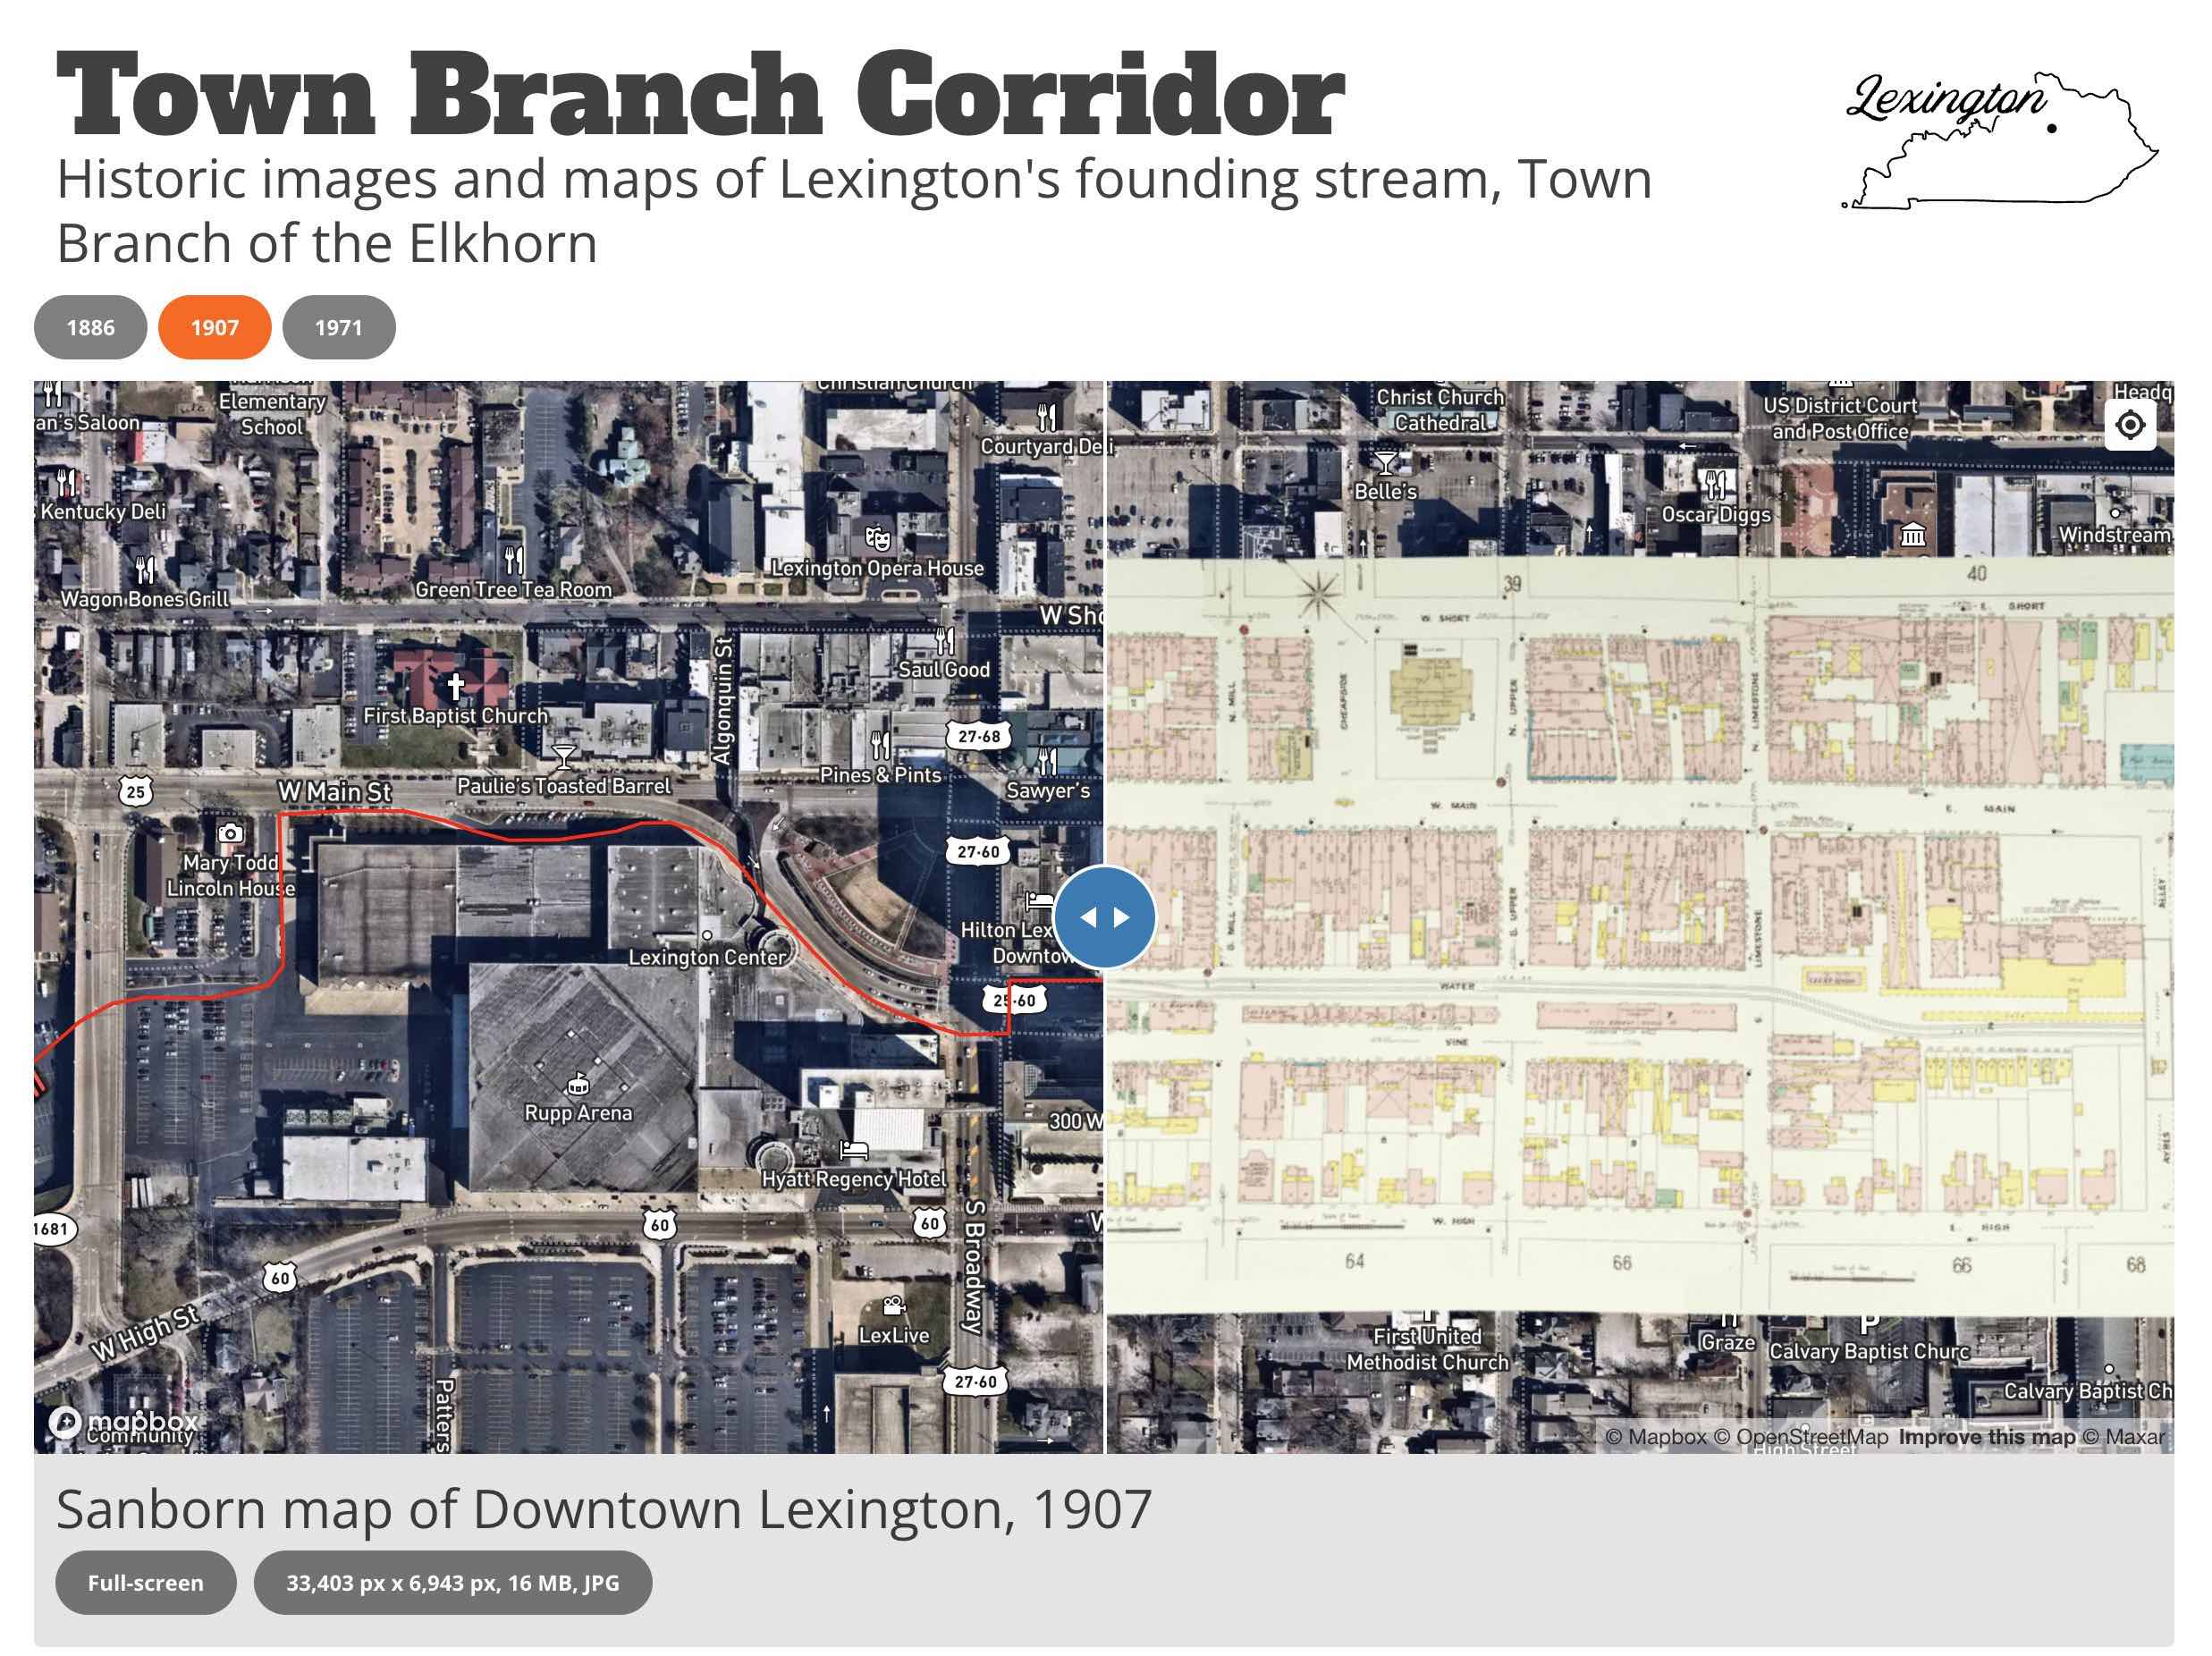
The course of Town Branch of the Elkhorn in Lexington has guided downtown's development and the orientation of its streets. Today, Town Branch is buried the city in a sewer. Explore georeferenced historic maps and compare with contemporary aerial imagery of this corridor. The proposed and partially built Town Branch Trail is shown. Presentation created for a DOPE Conference field trip. View interactive map.
No more group field trips
Spring semester, 2020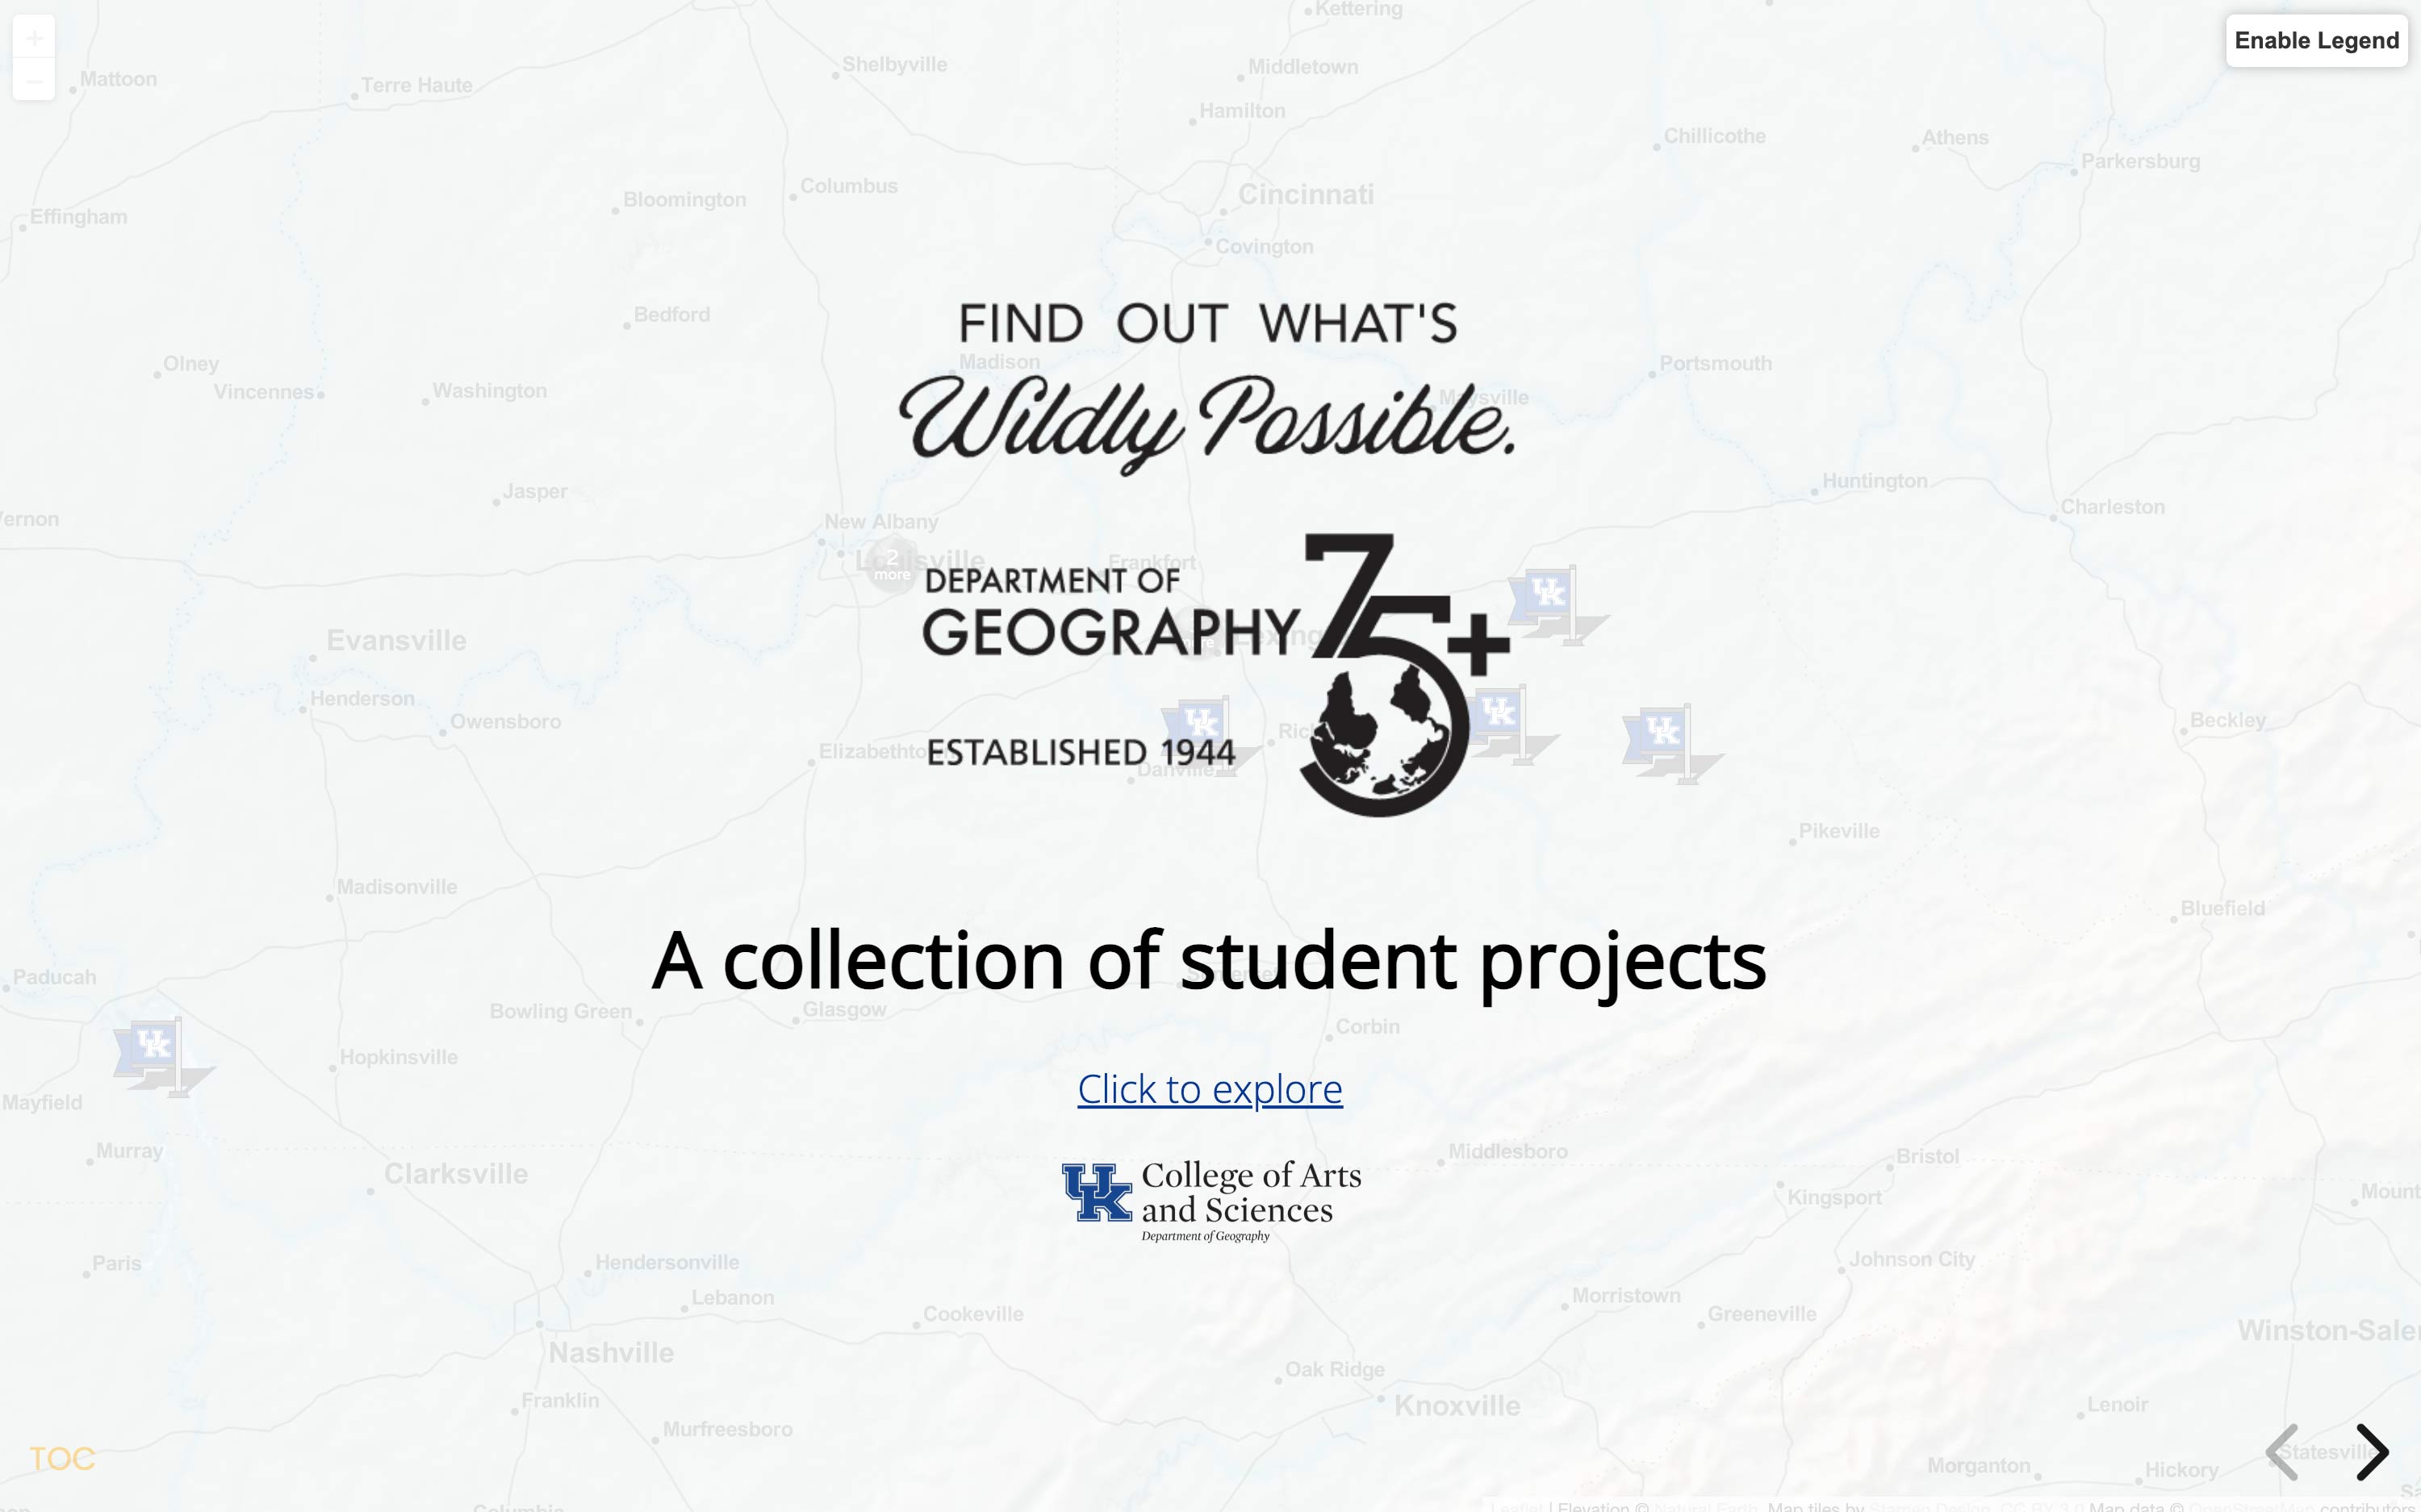
When the pandemic shutdown our classrooms and planned field trips, I decided to a map destinations we had visited in the past few years in various classes. Take a trip.
Lidar scan of bridge
Fall semester, 2019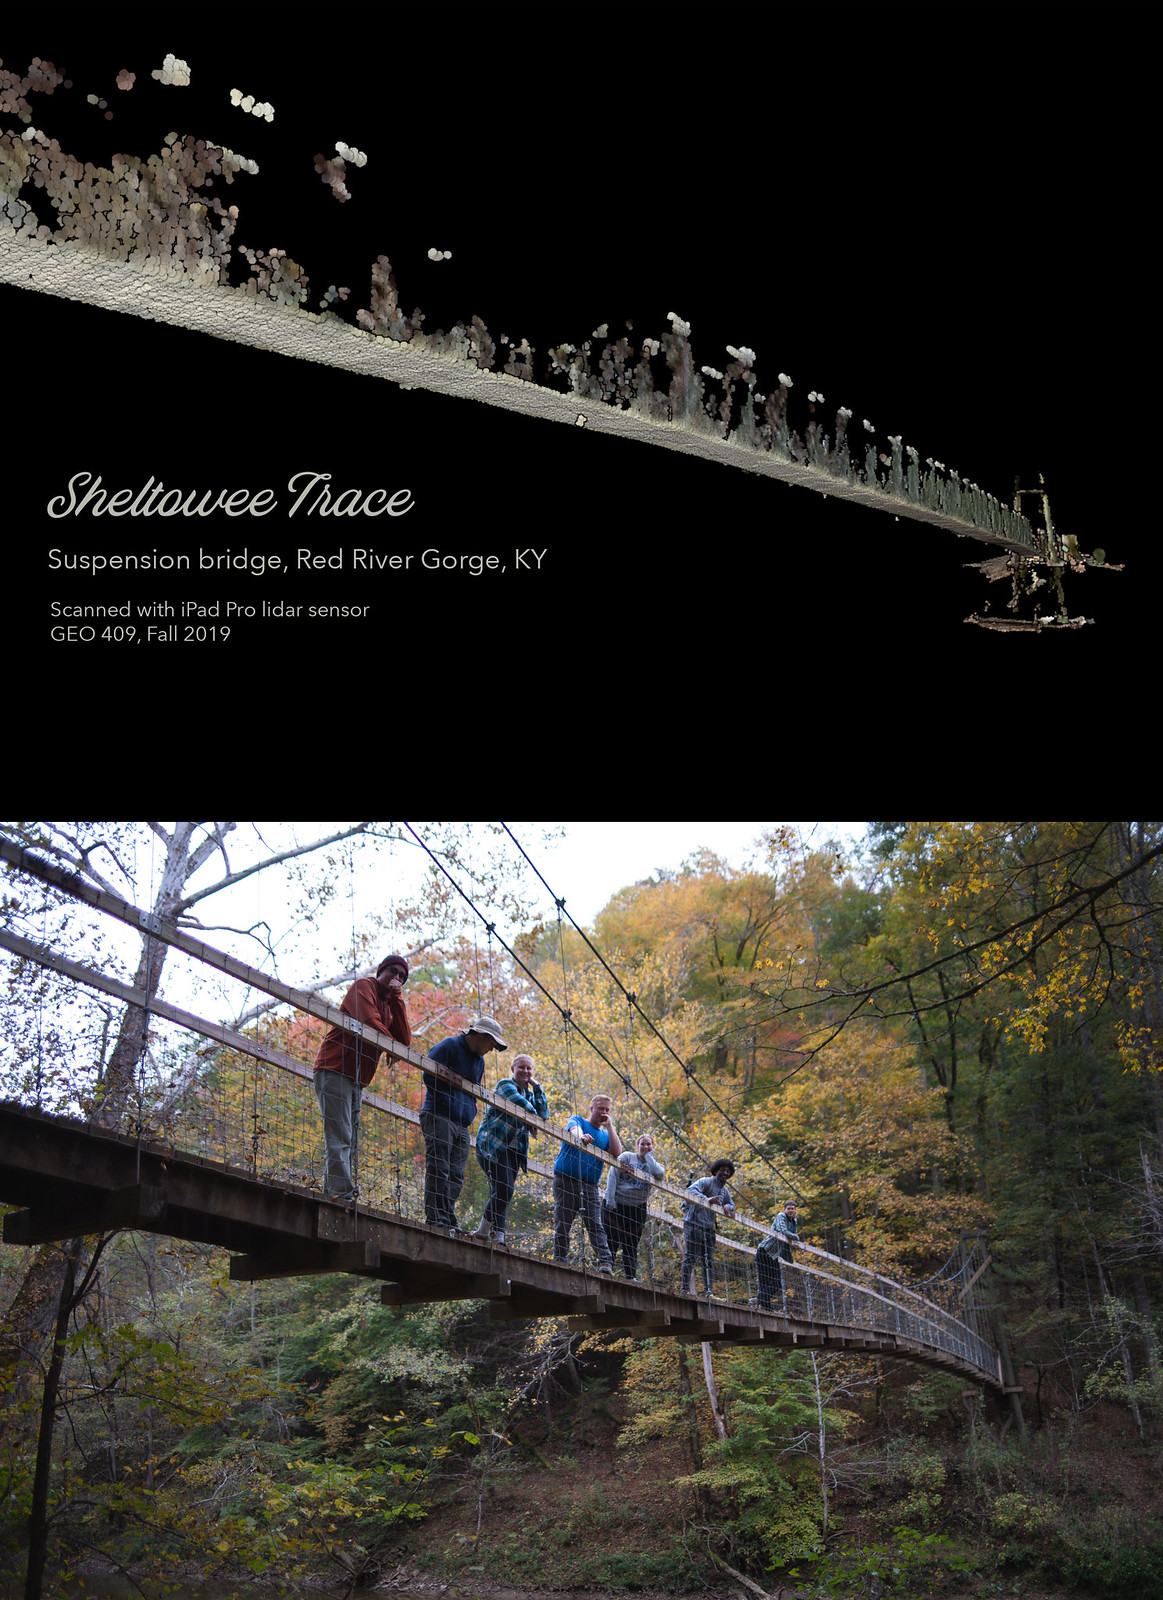
After a fall field trip to the Red River Gorge to test our maps, I discovered the lidar sensor on an iPad Pro. A half an hour of scanning yielded a fair model of the suspension bridge. Visit the interactive model.
Scenic trail index
Summer semester, 2019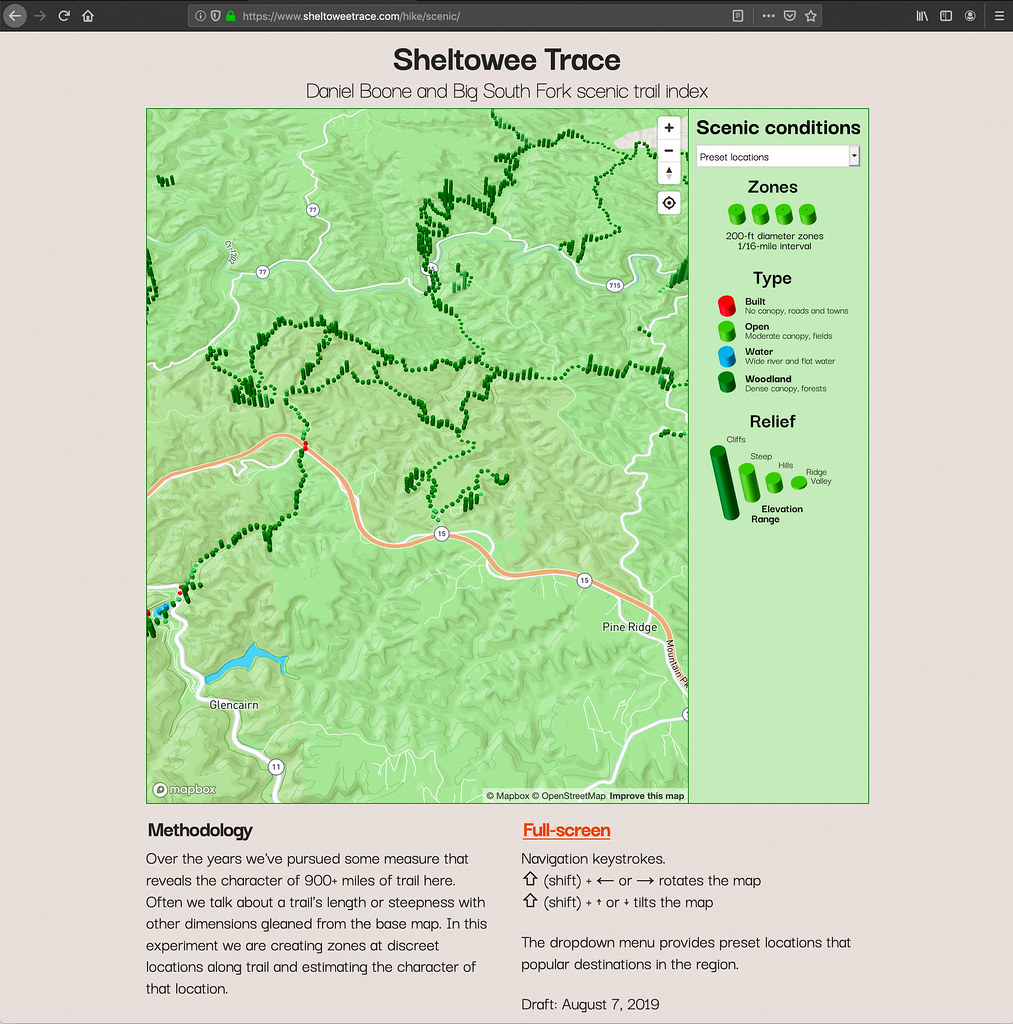
Often, we talk about a trail's length or steepness with other dimensions gleaned from the base map. In this experiment we are creating zones at discreet locations along trail and estimating the character of that location. Visit the 3D map and web page.
Historic entrance to Mammoth Cave rendered from lidar point cloud
Spring semester, 2019
45-second video of flyover to Mammoth Cave
A demonstration of ArcGIS Pro animation features using lidar data and aerial photography.
Lidar in the Red River Gorge
Fall semester, 2018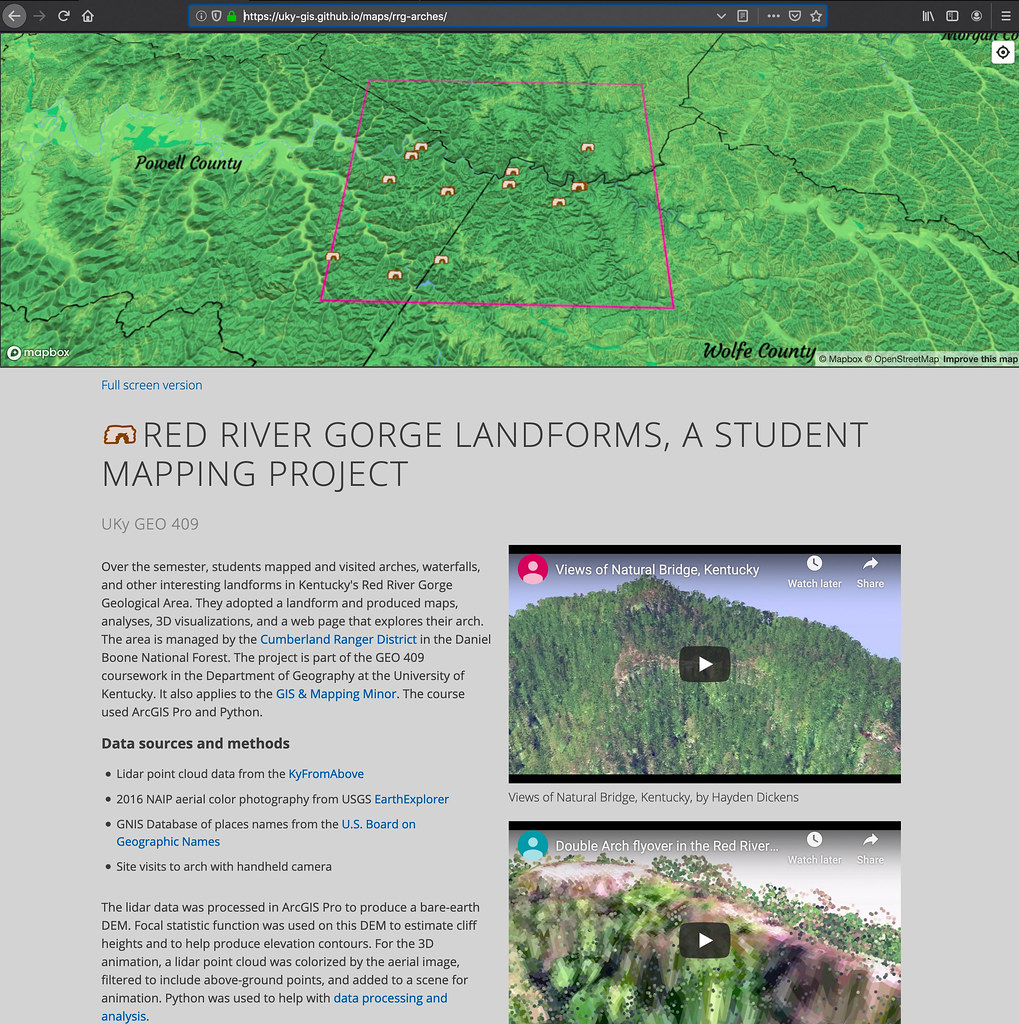
Over the semester, students mapped and visited arches, waterfalls, and other interesting landforms in Kentucky's Red River Gorge Geological Area. They adopted a landform and produced maps, analyses, 3D visualizations, and a web page that explores their arch. Visit the web page.
Bluegrass Trails, a student mapping project
Spring semester, 2018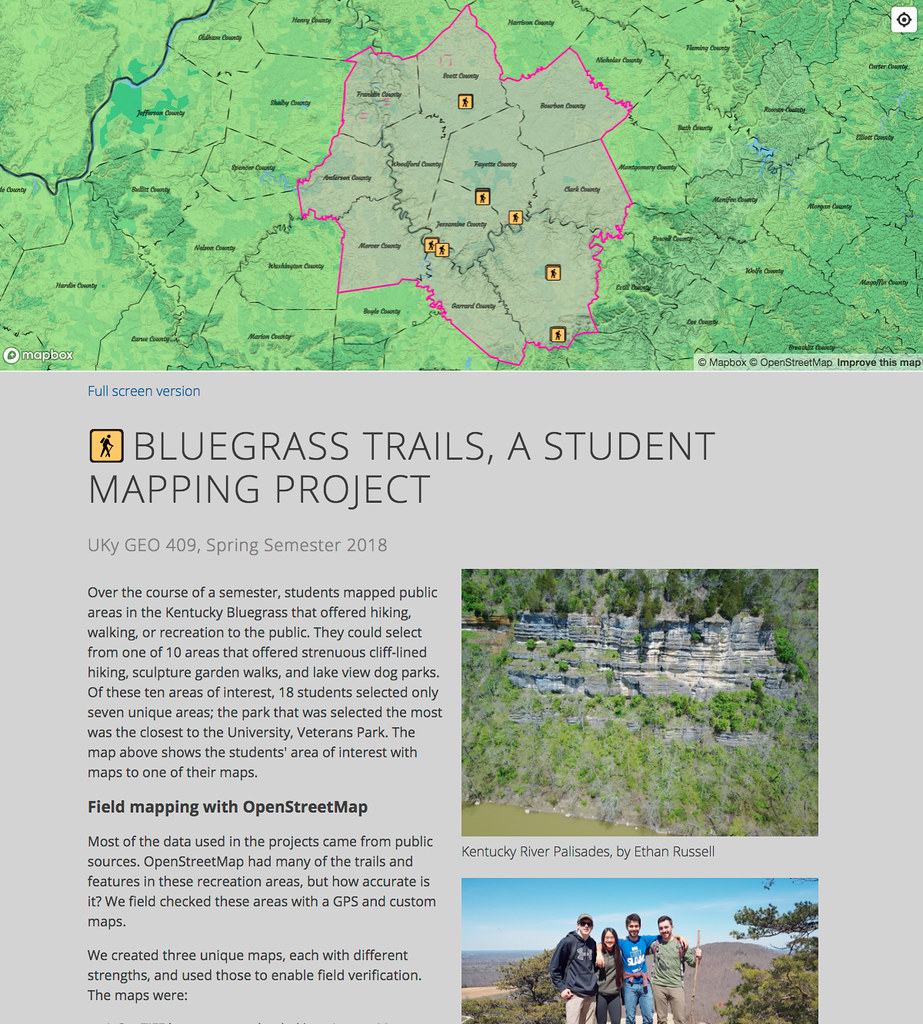
Students mapped public areas using open source software in the Kentucky Bluegrass that offered hiking, walking, or recreation to the public. They could select from one of 10 areas that offered strenuous cliff-lined hiking, sculpture garden walks, and lake-view dog parks. Visit the web page.
Cumberland Gap NHP map
Fall semester, 2017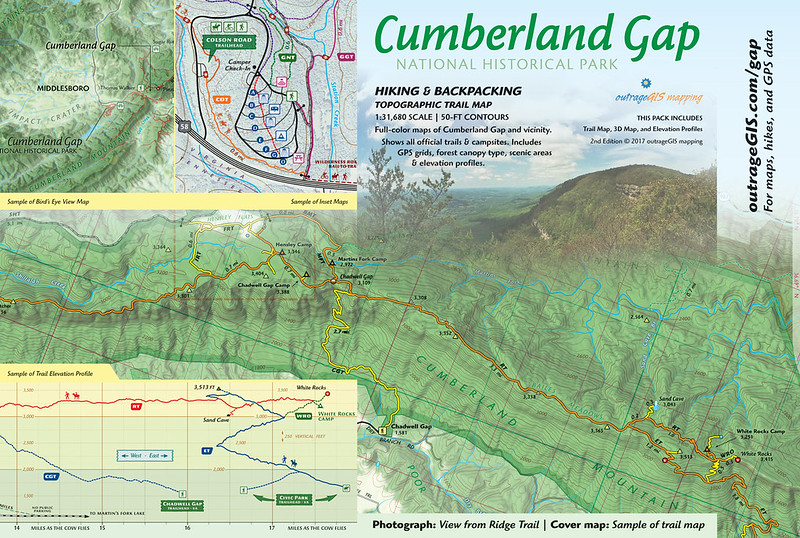 Explore Cumberland Gap Bird's Eye view!
Students map Town Branch Trail and publish a website
Spring, 2017 in Fayette County, Kentucky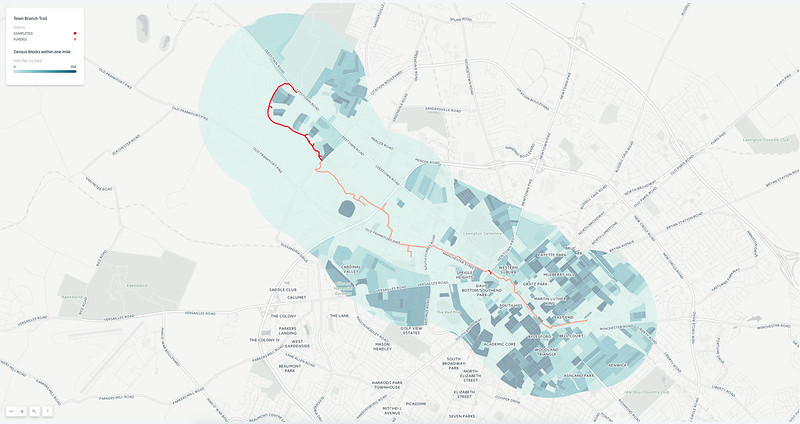
Town Branch Trail in maps
Students create many maps and a website for the soon-to-be-built Town Branch Trail during the Spring 2017 semester in the GEO 409 (Advanced Topics in GIS) in the Department of Geography, University of Kentucky. We used mainly open source GIS software QGIS and GitHub to create and publish our maps.
We used mainly open-source GIS software QGIS and GitHub to create and publish our maps. For the final project, students grouped into separate teams for web page production, field GPS and photography, story production, and 3D mapping.
An interactive map of the content produced for the final project can be found in the following map:
The students compiled their maps, geotagged photos, and stories in a nicely designed website (https://reece2ke.github.io/geo409_site).
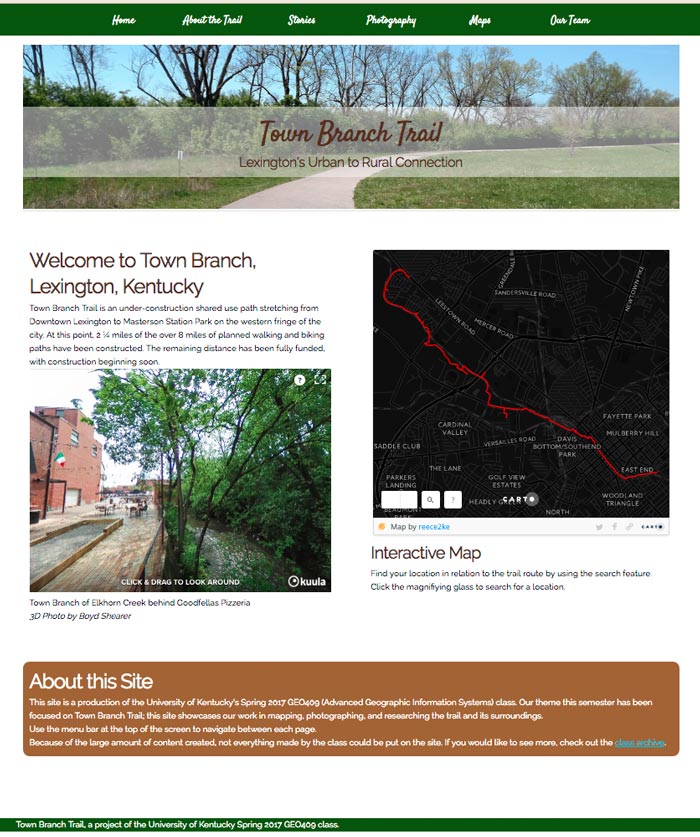
Student website for Town Branch Trail
We focused on 3D mapping in the last part of the semester. The maps and animations can be found on this website (http://boydx.github.io/tbt).
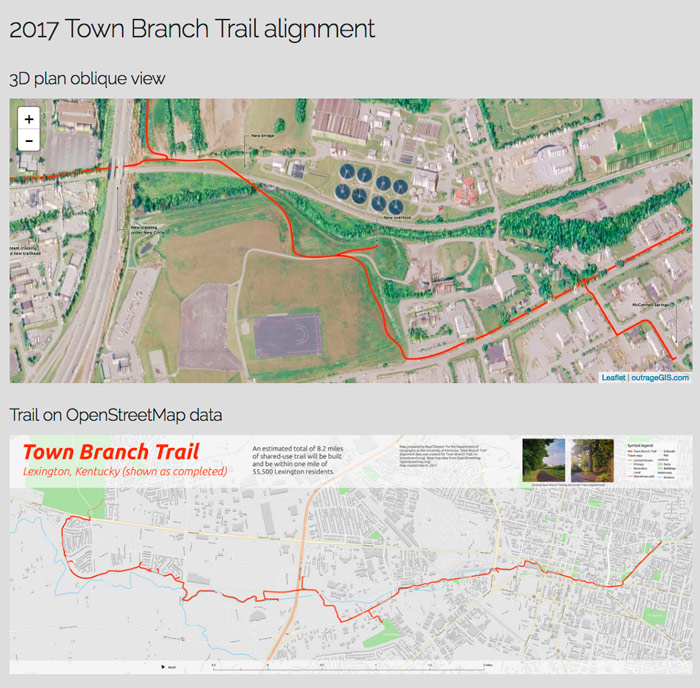
Town Branch Trail in Maps
Pilot Knob State Nature Preserve student mapping project
Fall, 2016 in Powell County, Kentucky
Students in NRE 355 (a GIS calass at the University of Kentucky Natural Resources and Environmental Sciences program) visited the 740-acre Pilot Knob State Nature Preserve on September 21, 2016, and used mobile devices to collect GPS data for the existing trail network. They mapped approximately 3.2 miles of trail then used ArcGIS and CARTO to measure the trails and create a 2D map and 3D visualizations of the nature preserve. Students then created websites to showcase their work.
http://sweb.uky.edu/~blshea1/nre355/pksnp contains maps, animations, and links to student pages.
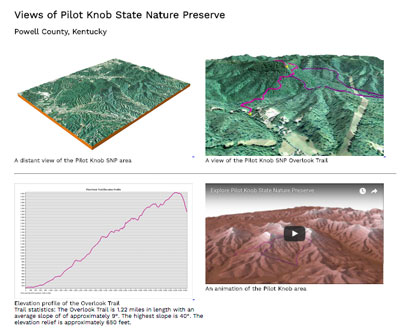 3D views and animations of Pilot Knob State Nature Preserve.
Bike/Pedestrian v. Car Collision Analysis
January 2004 to April 2016 in Fayette County, Kentucky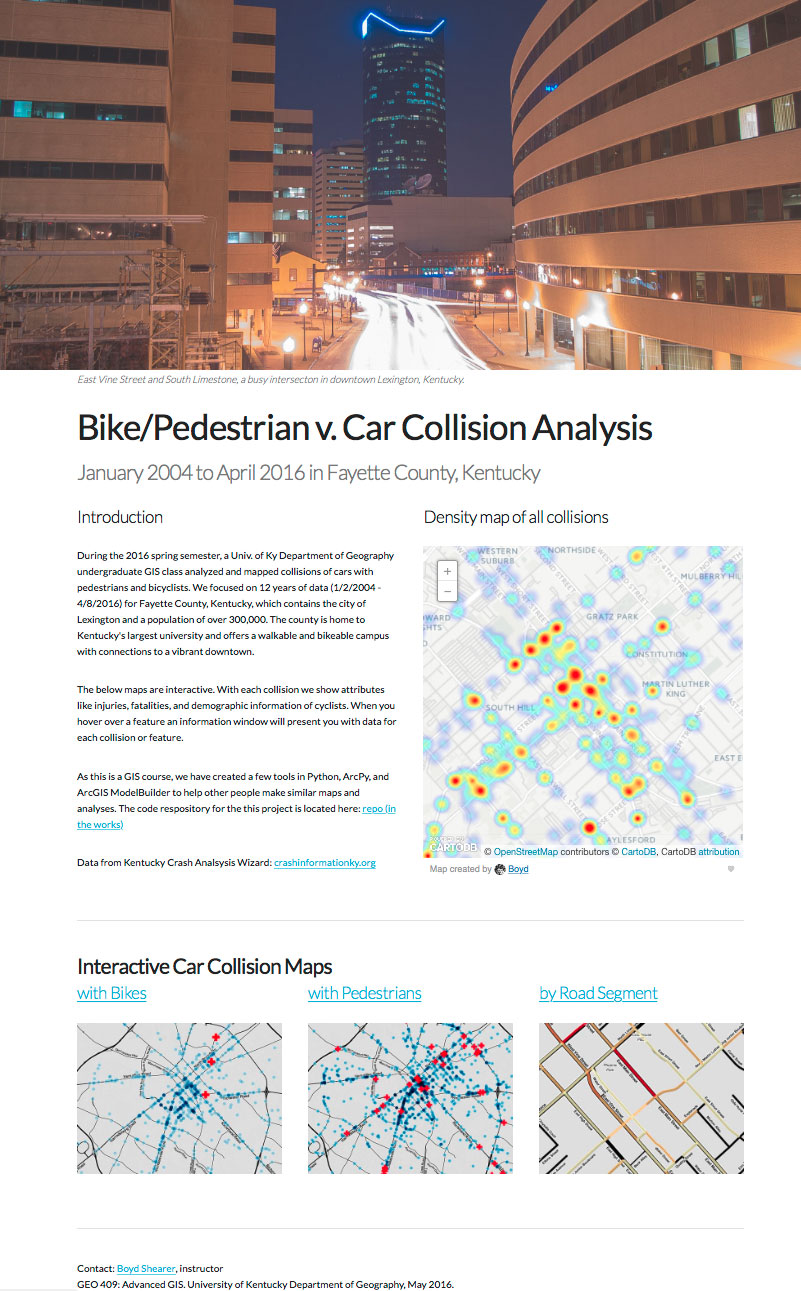
During the 2016 spring semester, GEO 409 undergraduate GIS class analyzed and mapped collisions of cars with pedestrians and bicyclists. We focused on 12 years of data (1/2/2004 - 4/8/2016) for Fayette County, Kentucky, which contains the city of Lexington and a population of over 300,000. The county is home to Kentucky's largest university (us!) and offers a walkable and bikeable campus with connections to a vibrant downtown. Explore these maps to find demographic information of cyclists involved in collisions with automobiles.
3D mapping and scripting in ArcPy
Automating the processing of spatial data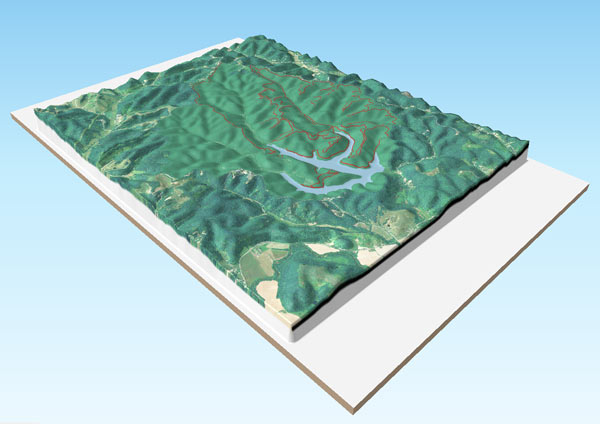
In Geo 409, we developed tools to process spatial data for any area of interest and feed other visualization platforms, like QGIS 3d mapping and CartoDB. This lab had an utility outside of class. A guidebook publishing company, Wolverine Publishing, needed maps for a popular climbing area in Idaho, City of Rocks. Find the Github repo and sample maps here.
Lexington's Urban Tree Canopy Cover
An exploration of measuring canopy cover in Lexington's urban service area
Inspired by the Davey Resource Group's October 2013 study of canopy cover using 2012 NAIP imagery within Lexington's Urban Service Area, a GIS class at the University of Kentucky created a similar, though limited, evaluation. We used 2014 NAIP imagery to create an NDVI image and field tested our canopy threshold at a NDVI value of 0.23. Our measurement was generally higher by 1%, since we did not remove areas with a high vegetative index, such as baseball fields, as was done by the Davey Resource Group. Using zonal statistics on both canopy cover datasets, we counted the number of pixels classified as canopy cover by polygon features in parcels, landuse, and US Census blocks and block groups. We also looked at canopy rates per person via the 2010 census blocks and 2013 median home value.
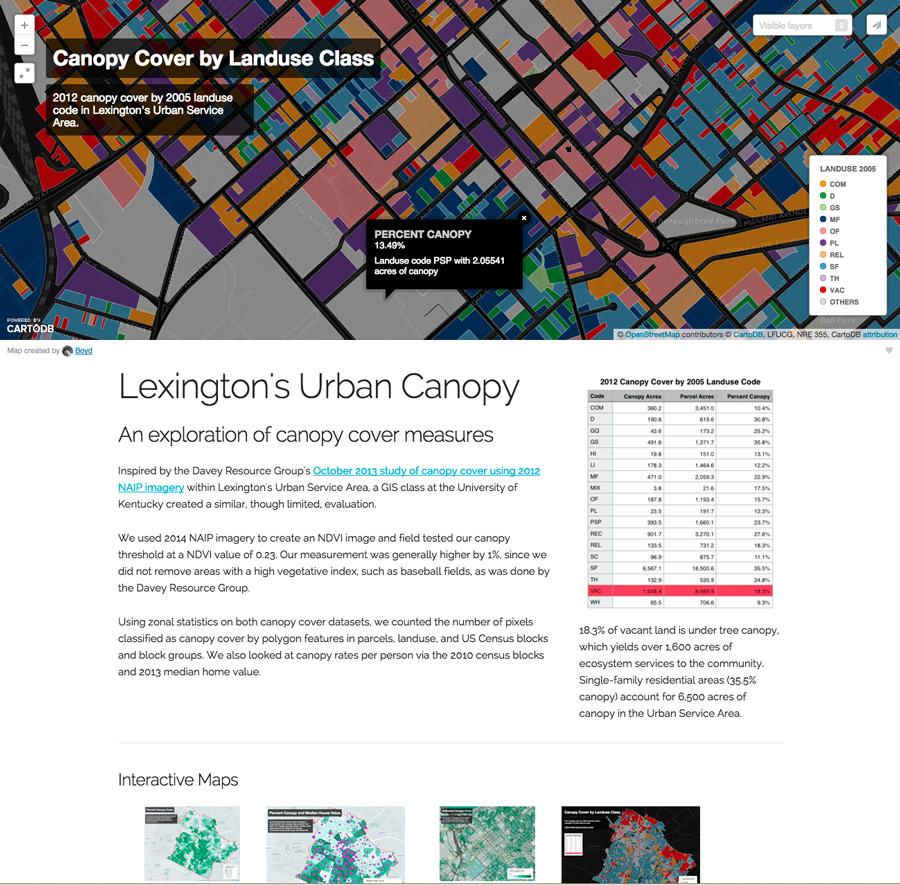
Pine Mountain Canopy Tour 2015
Environmental tourism opportunities in southeastern Kentucky
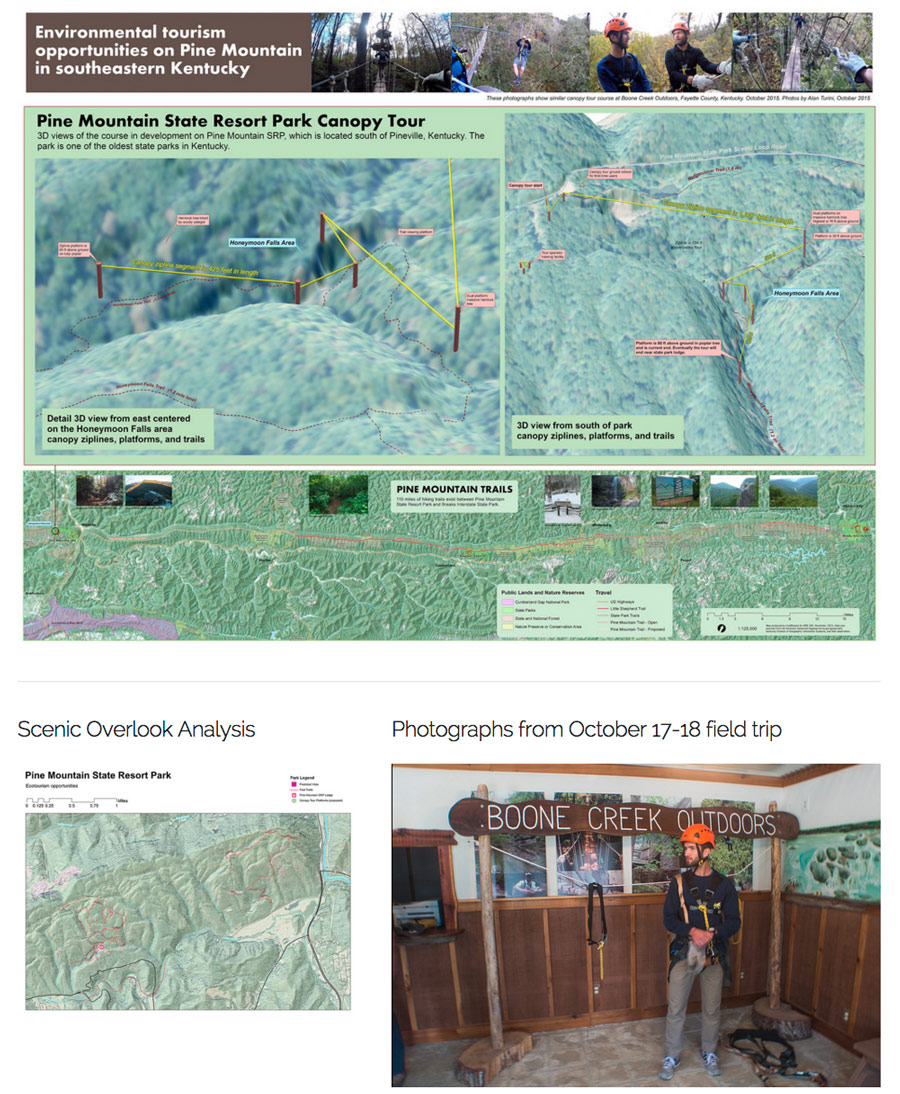
In October 2015 an undergraduate GIS class at the University of Kentucky endeavored to map and analyze environmental tourism assets on Pine Mountain. During discussions with Pine Mountain State Resort Park, we discovered a canopy zipline tour, one of the first in the state, was being installed in the park. We contacted the developer, Burgess Carey, and asked if we could map the canopy zipline course. We participated in a canopy tour at Boone Creek Outdoors to better understand this unique mapping challenge. We subsequently went to Pine Mountain and GPS located the canopy platforms and measured their heights. In the lab we made 3D views with ESRI's ArcScene and mapped nearby recreational assets using ArcMap.
Robinson Forest Summer Camp Trail Mapping Exercise
NRES Summer Camp 2015
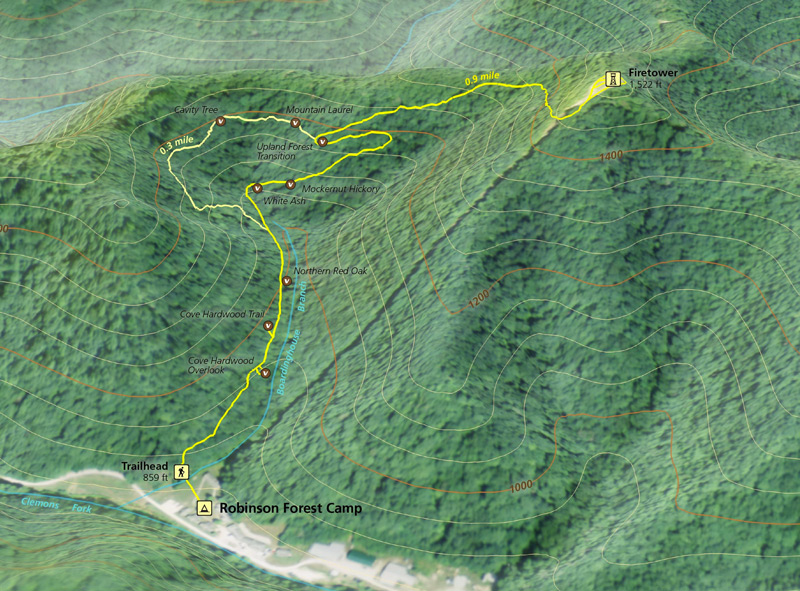
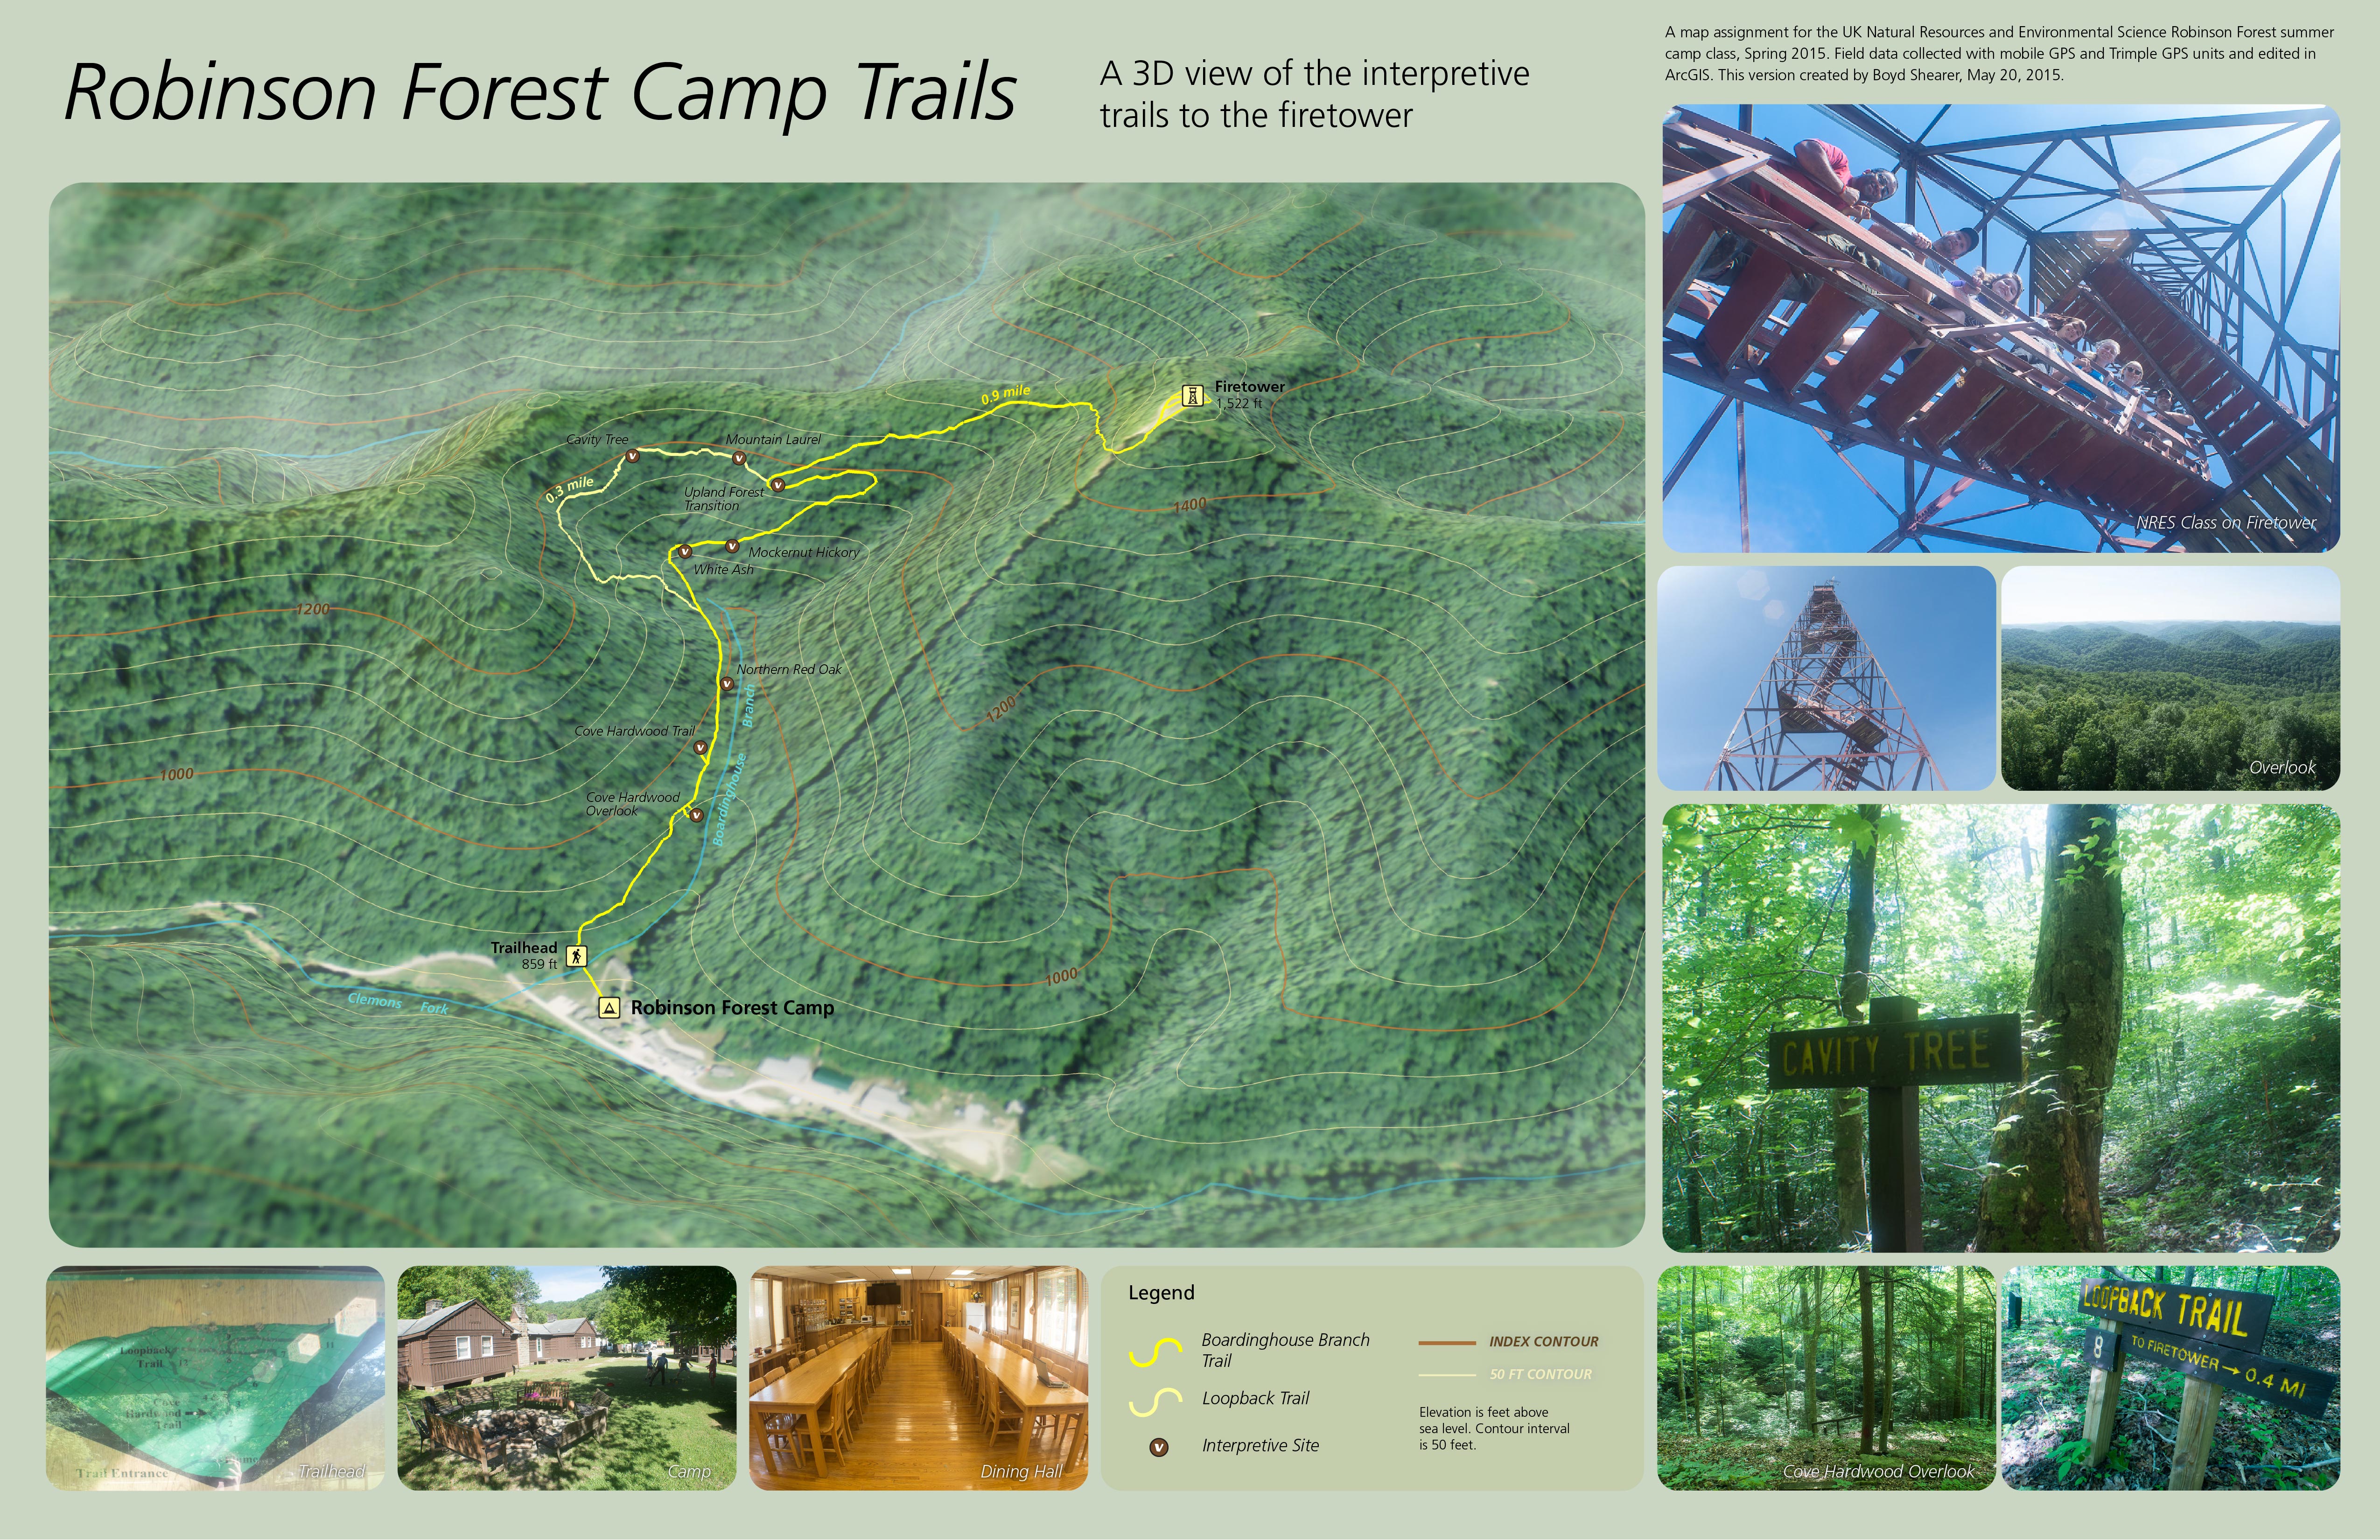
As part of UK Natural Resources and Environmental Sciences 2015 Summer Camp, I taught a one-day GPS and GIS exercise to map the interpretive trails around base camp. With seven undergraduates and their mobile devices and one Trimble ProXRS, we split into three teams. One team focused on the trail network and GPS mapped trail alignment and intersections. A second team mapped interpretive sites on the left-side of trials, while a third-team mapped right-side features. In the second-half of the day, we worked in the classroom and on laptops to make a map in ArcGIS. Some students had GIS software experience and helped their fellow classmates to make a map as a geospatial PDF and use on their mobile devices. A GeoPDF is a mobile map that doesn't require a cellular data connection to function.
Student Observations and Analysis of UK Campus Celebrations
During (and after) the 2015 UK men’s NCAA basketball tournament games
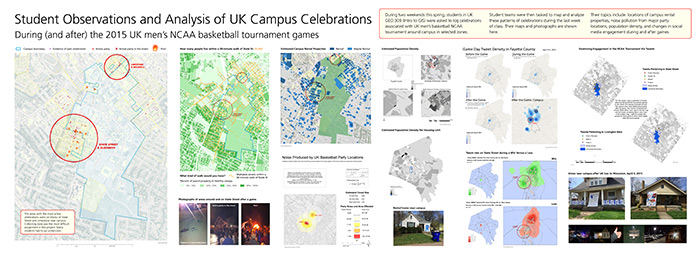
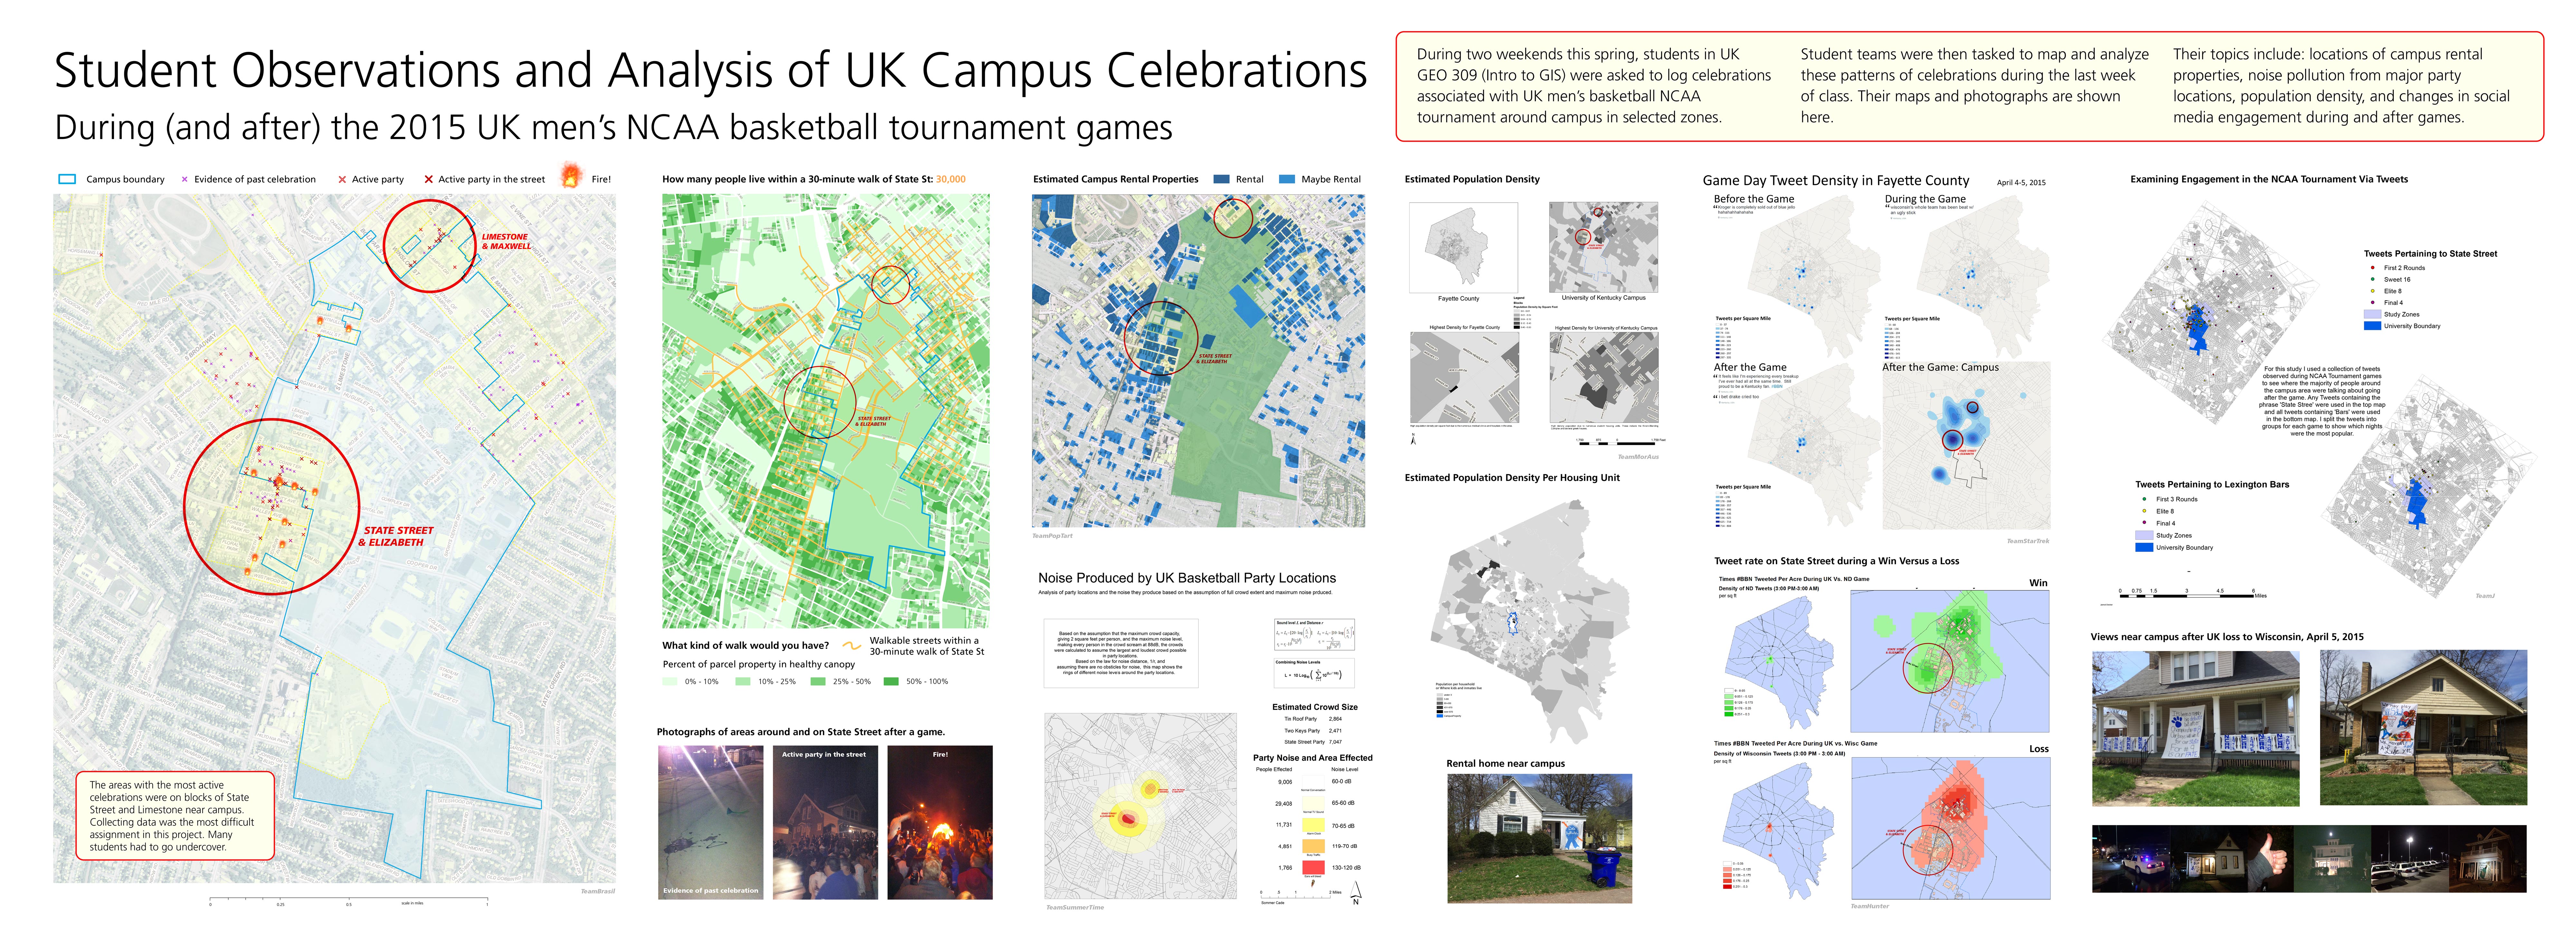
During two weekends this spring, students in UK GEO 309 (Intro to GIS) were asked to log celebrations associated with UK men’s basketball NCAA tournament around campus in selected zones. Student teams were then tasked to map and analyze these patterns of celebrations during the last week of class. Their maps and photographs are shown here.
Their topics include: locations of campus rental properties, noise pollution from major party locations, population density, and changes in social media engagement during and after games.
Their topics include: locations of campus rental properties, noise pollution from major party locations, population density, and changes in social media engagement during and after games.
Social and Environmental Distress in Kentucky
April, 2015
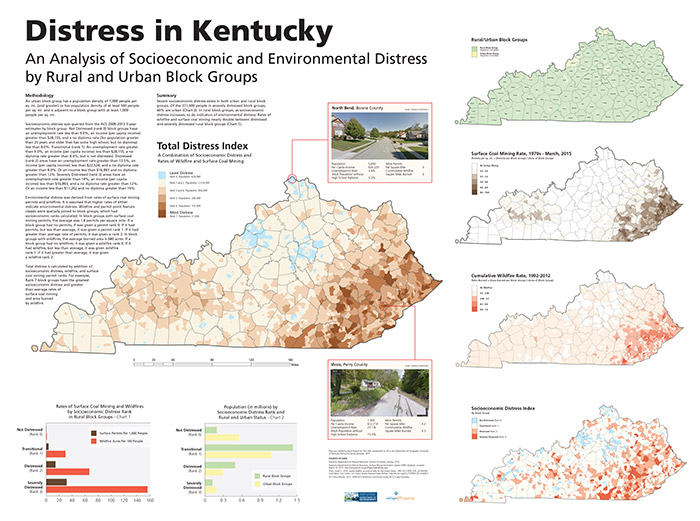
Severe socioeconomic distress exists in both urban and rural block groups in Kentucky. Of the 311,000 people in severely distressed block groups, 60% are urban. In rural block groups, as socioeconomic distress increases, so do indicators of environmental distress. Rates of wildfire and surface coal mining nearly double between distressed and severely distressed rural block groups.

Read more
Read more
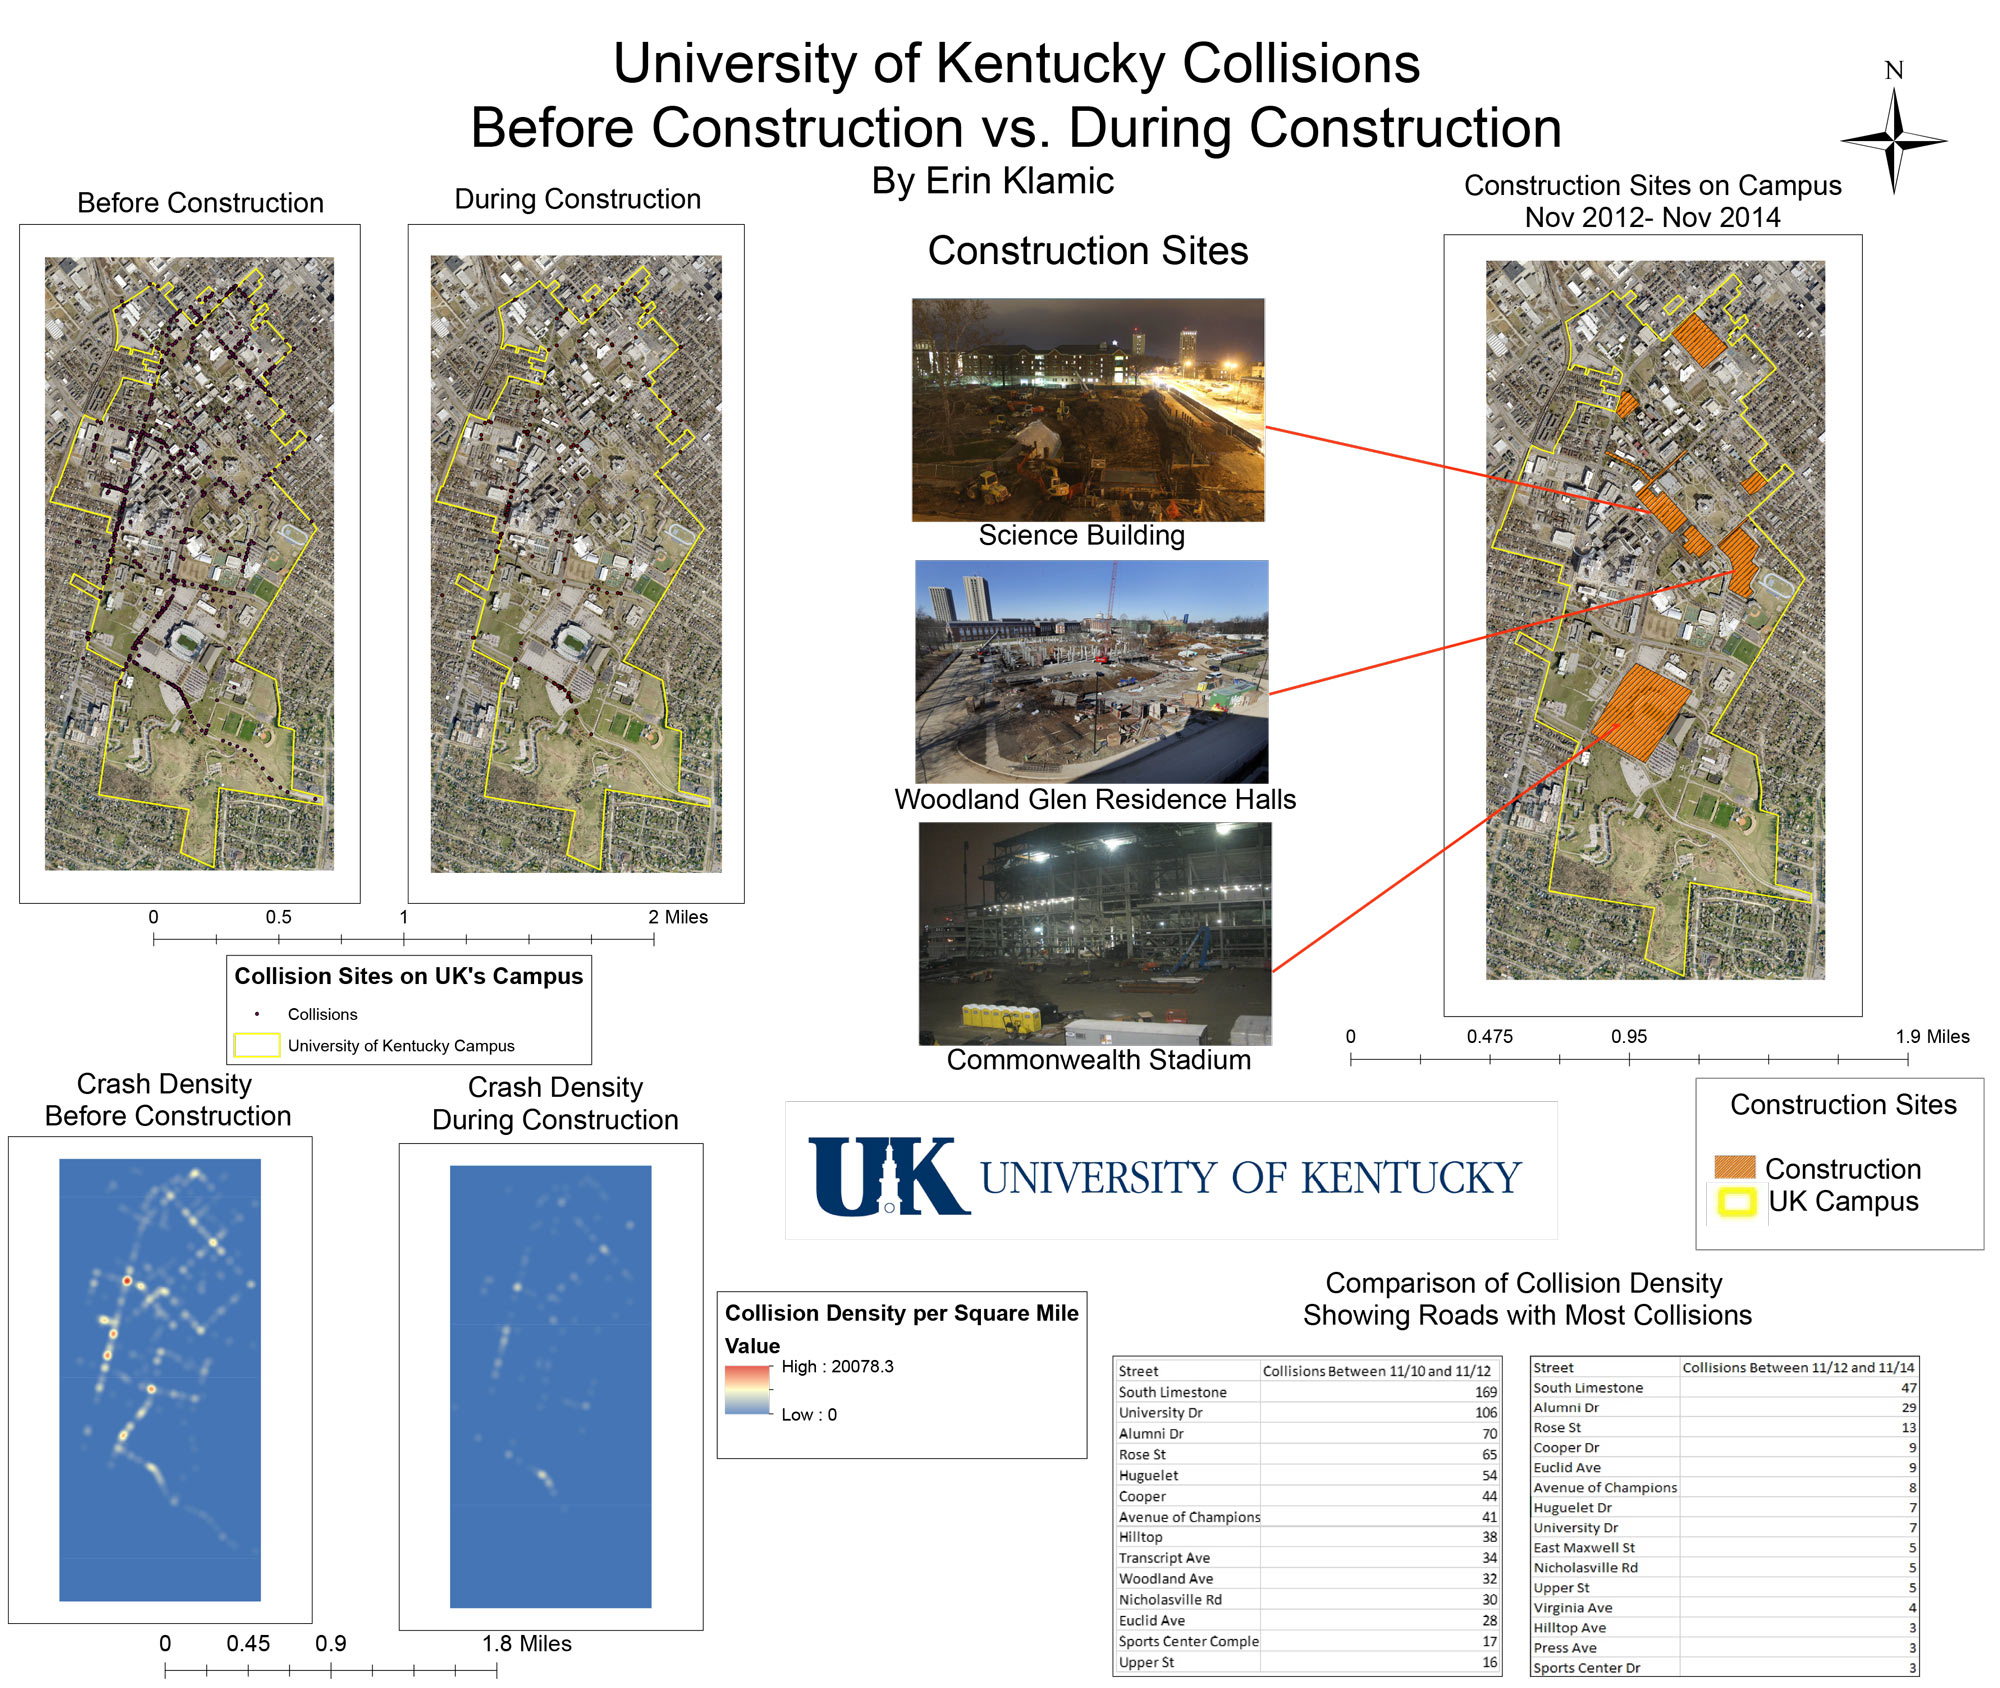
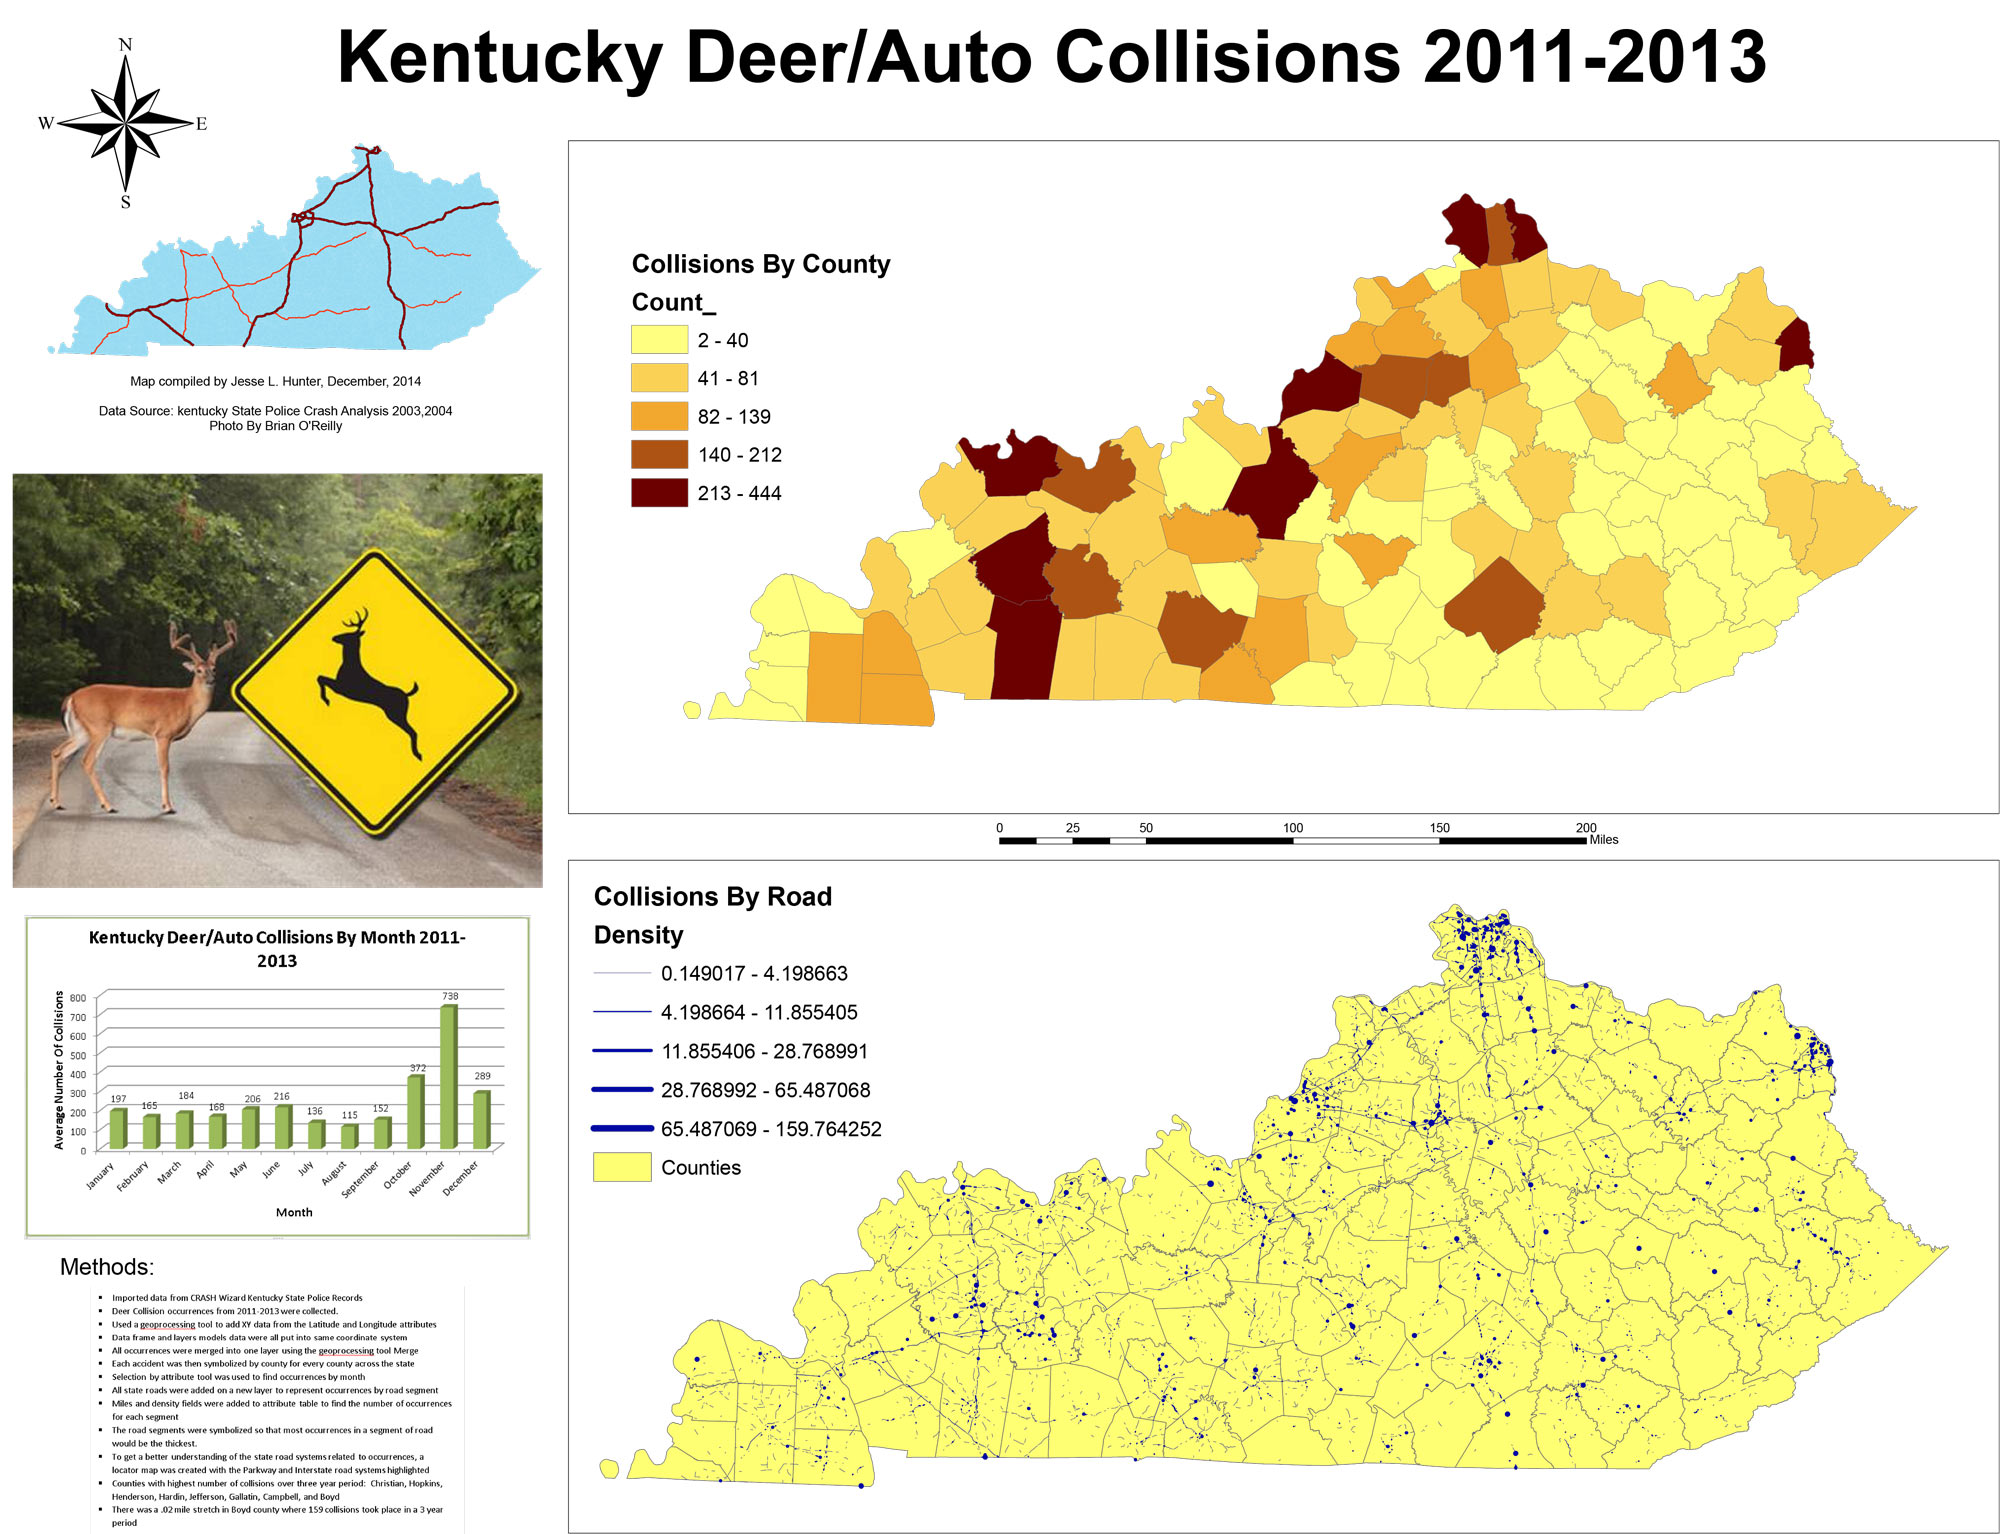
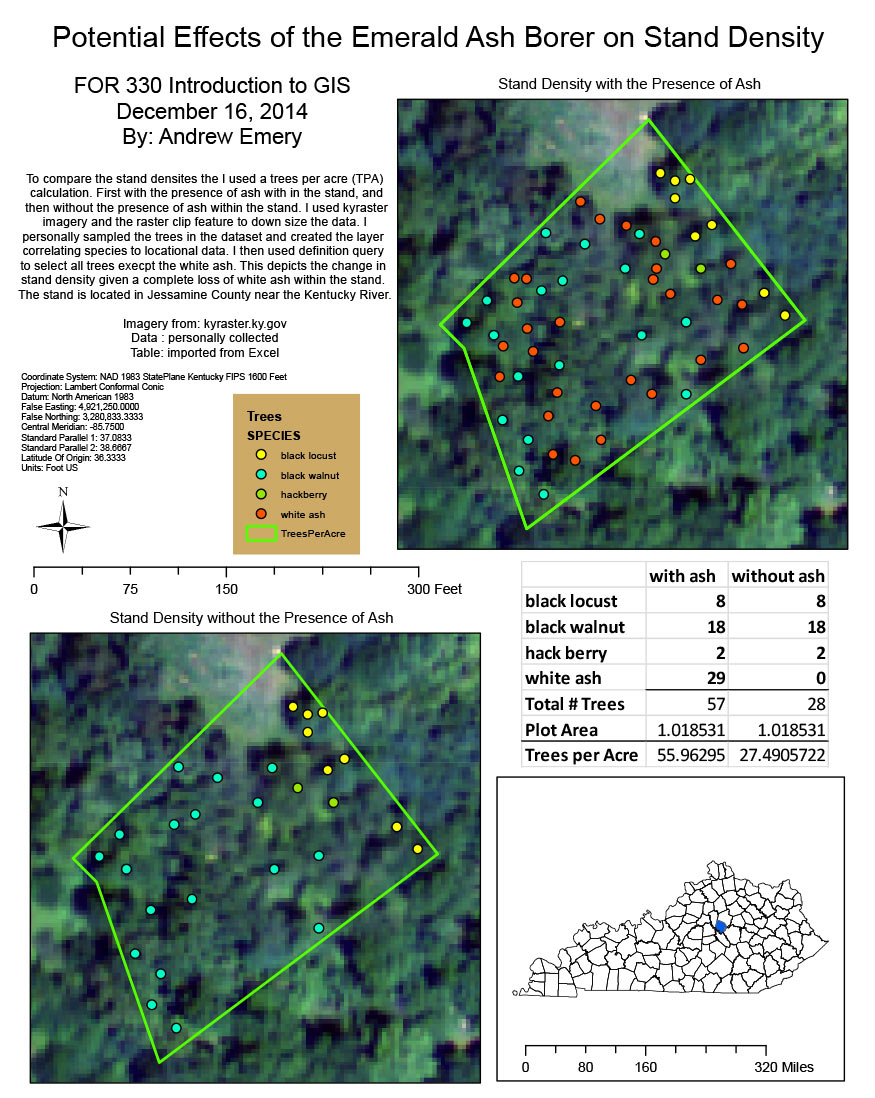
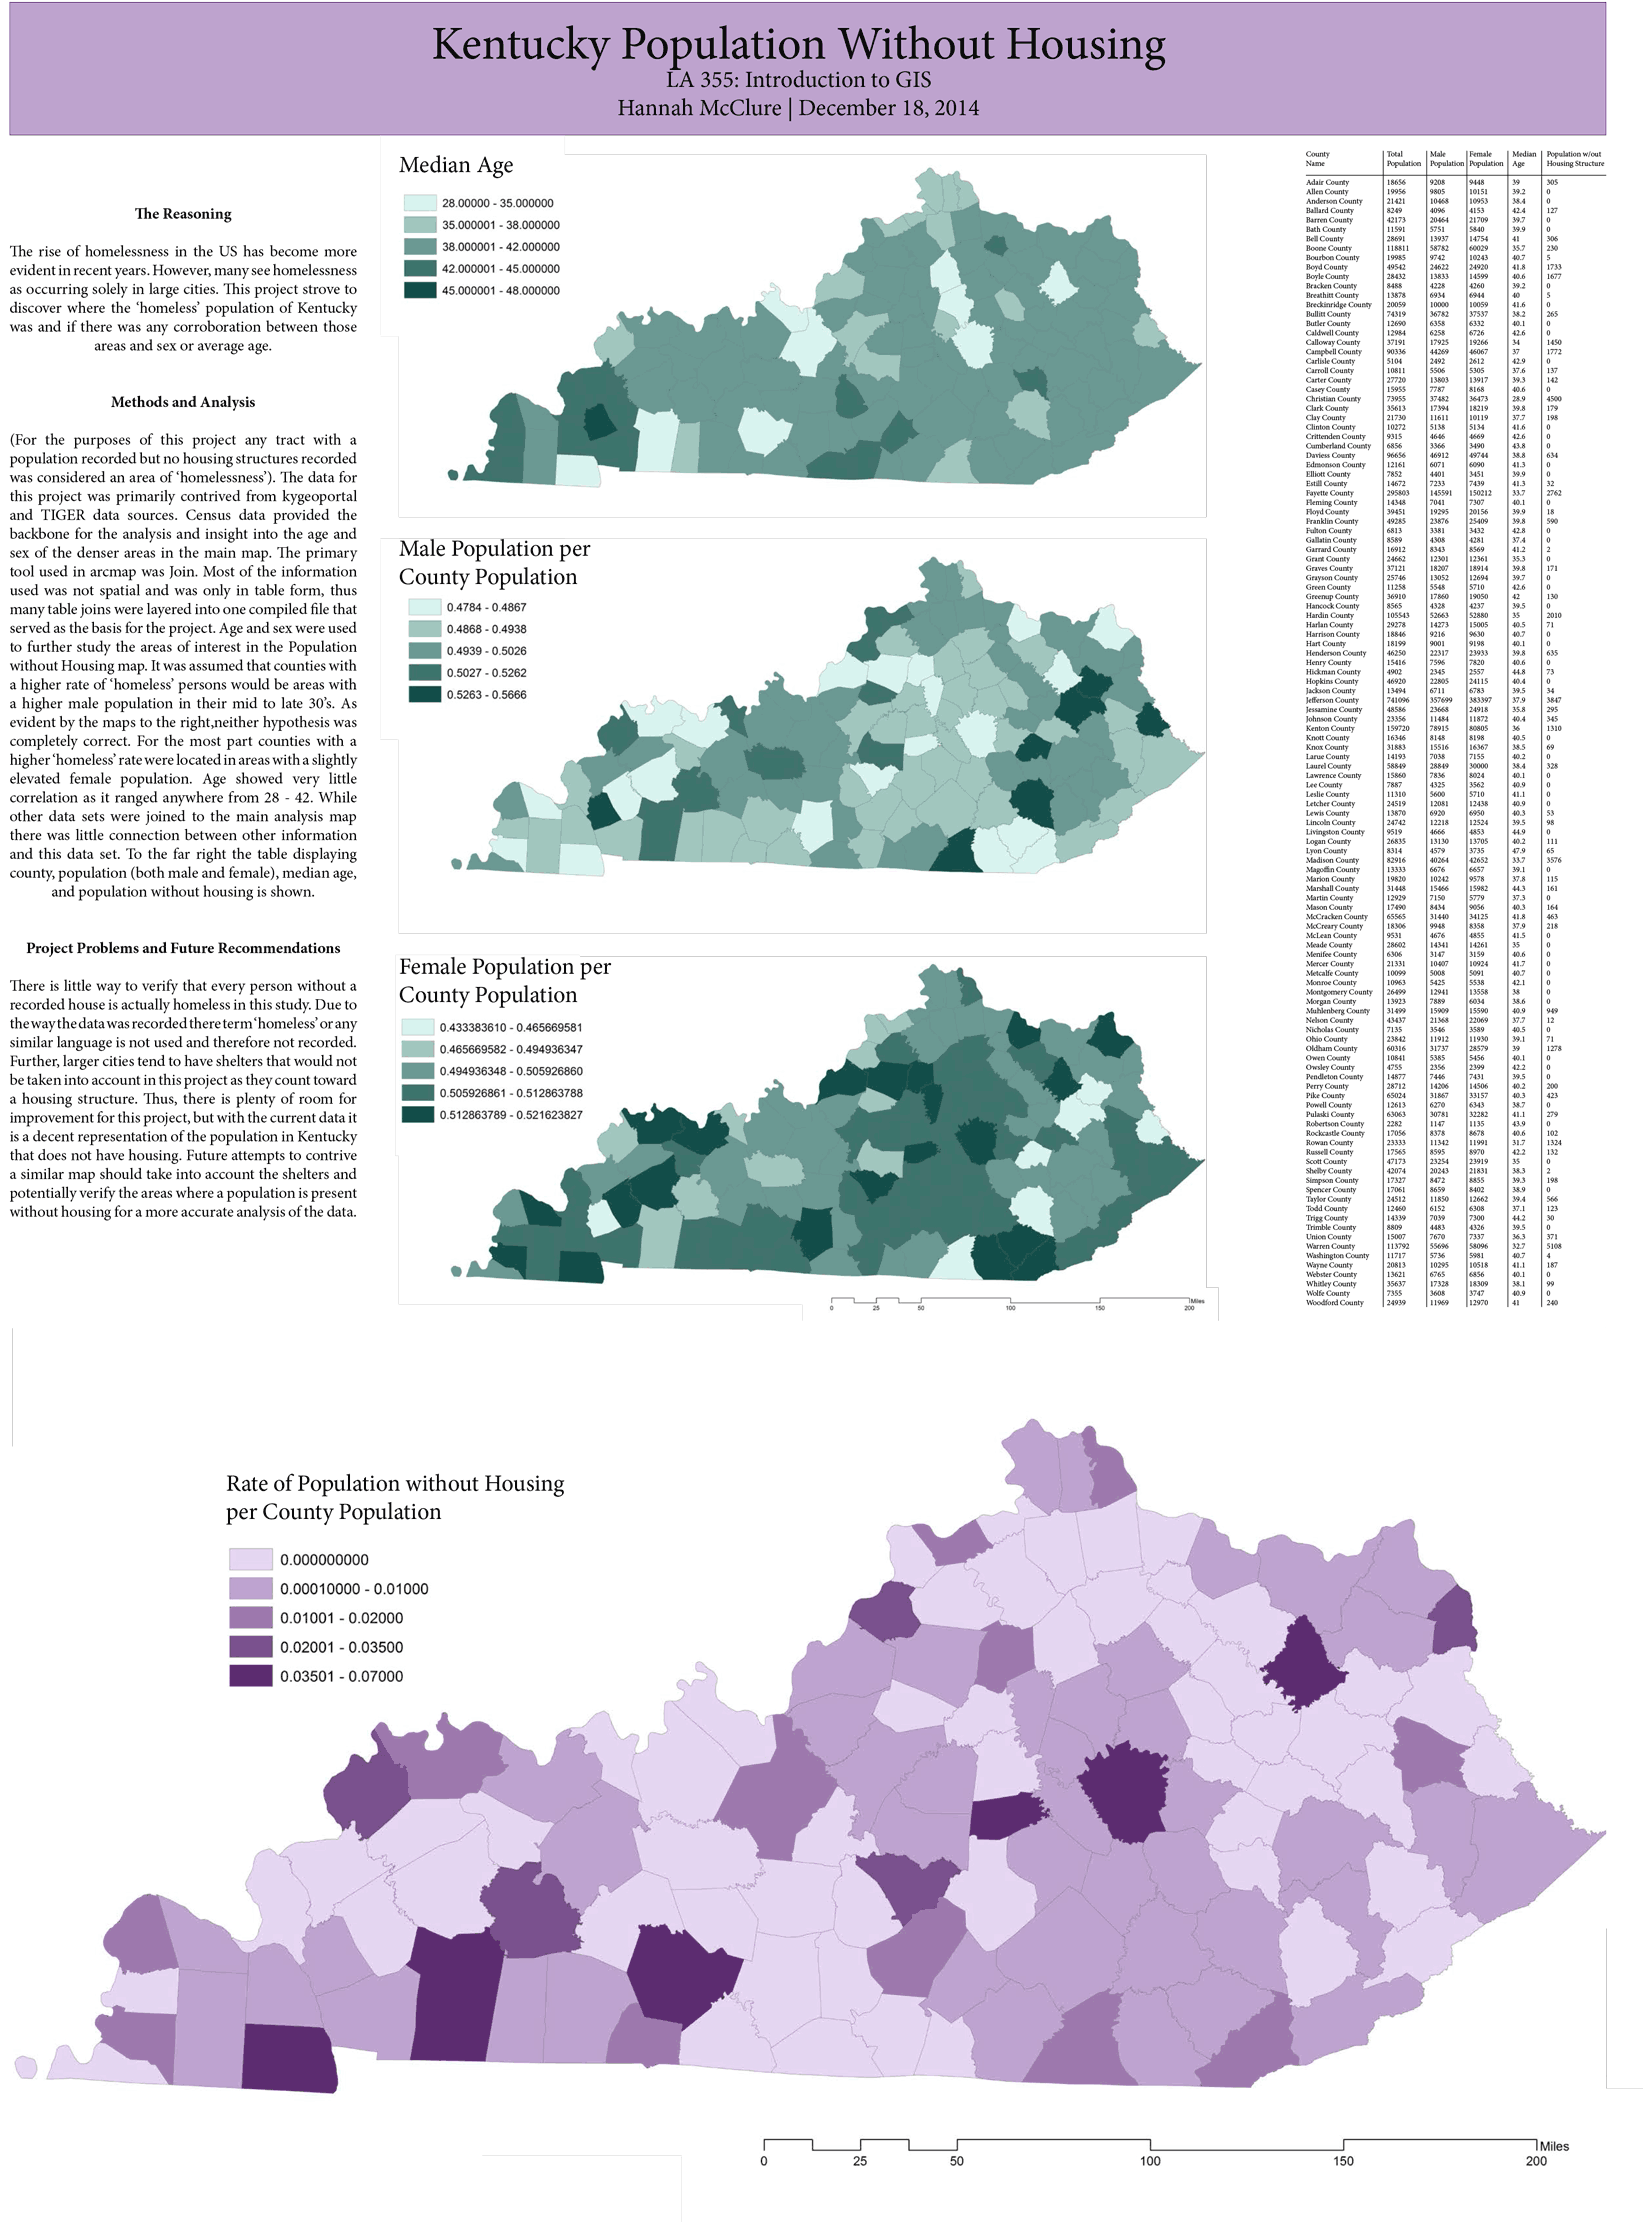
A selection of student map projects, Fall semester, 2014
Final posters from GIS courses at the University of Kentucky College of Agriculture, Food, and Environment (FOR 330, NRE 355, and LA 355).
|

|
|
|
|
|

|
|
|
Town Branch Trail and Density of Healthy Canopy, December, 2014

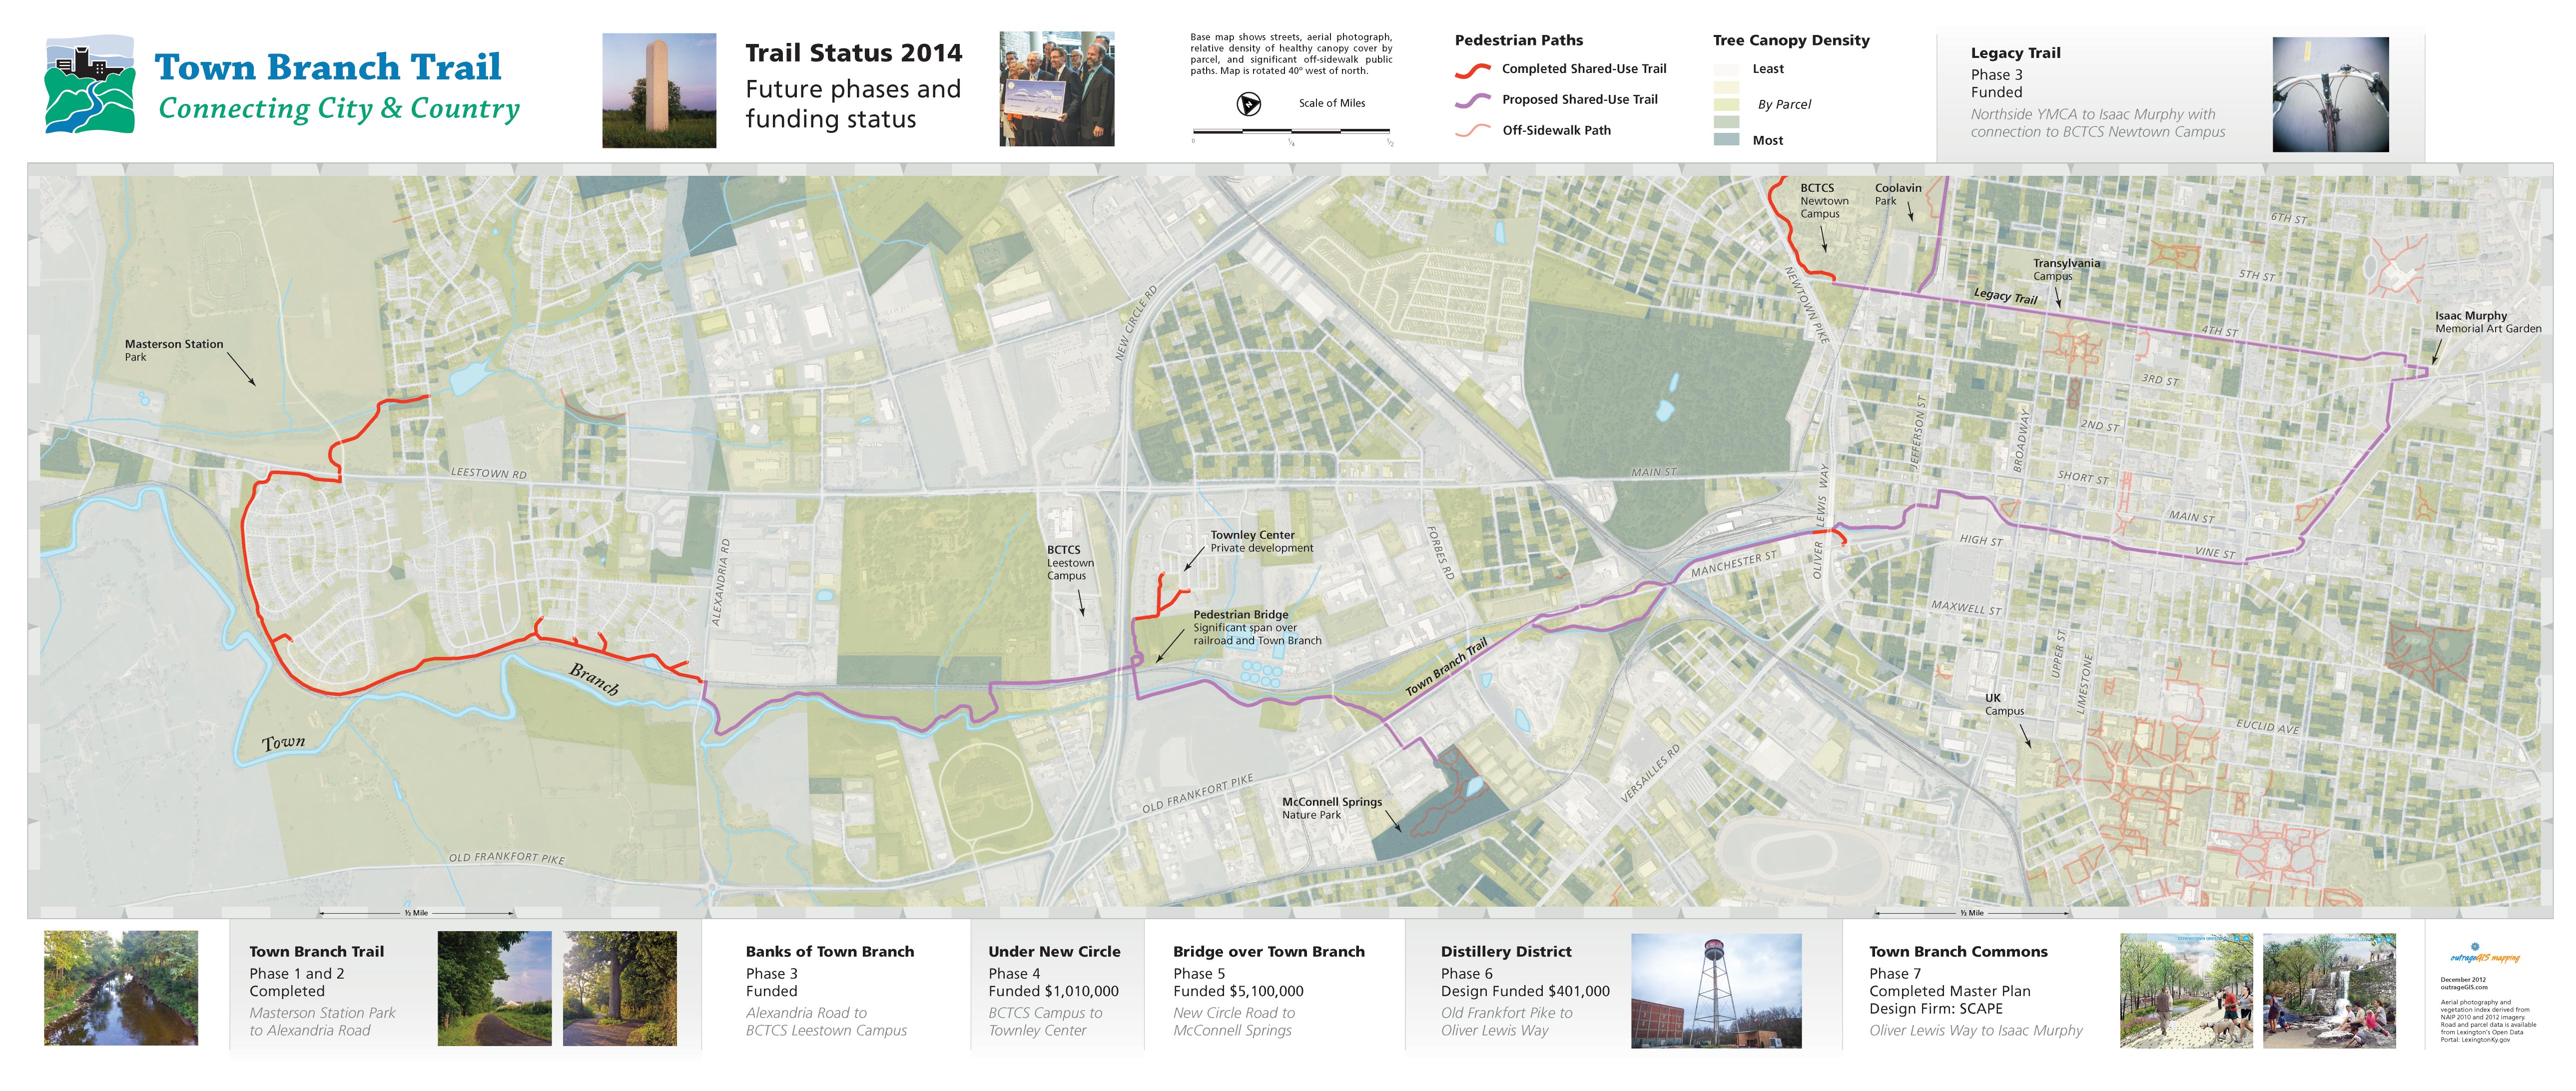
Town Branch Trail is a developing shared-use trail connecting downtown Lexington with the city's outer countryside. The exercise shows the completed and funded phases for the trail, and assesses the extent and health of trees along the trail. Using NAIP 2012 imagery an NDVI (Normalized Difference Vegetation Index) was created and then shown as a ratio per parcel area. After viewing the initial results, a student said, "This is a realtor's map!" and then quickly visited the PVA website to compare property values to its 'green index.'
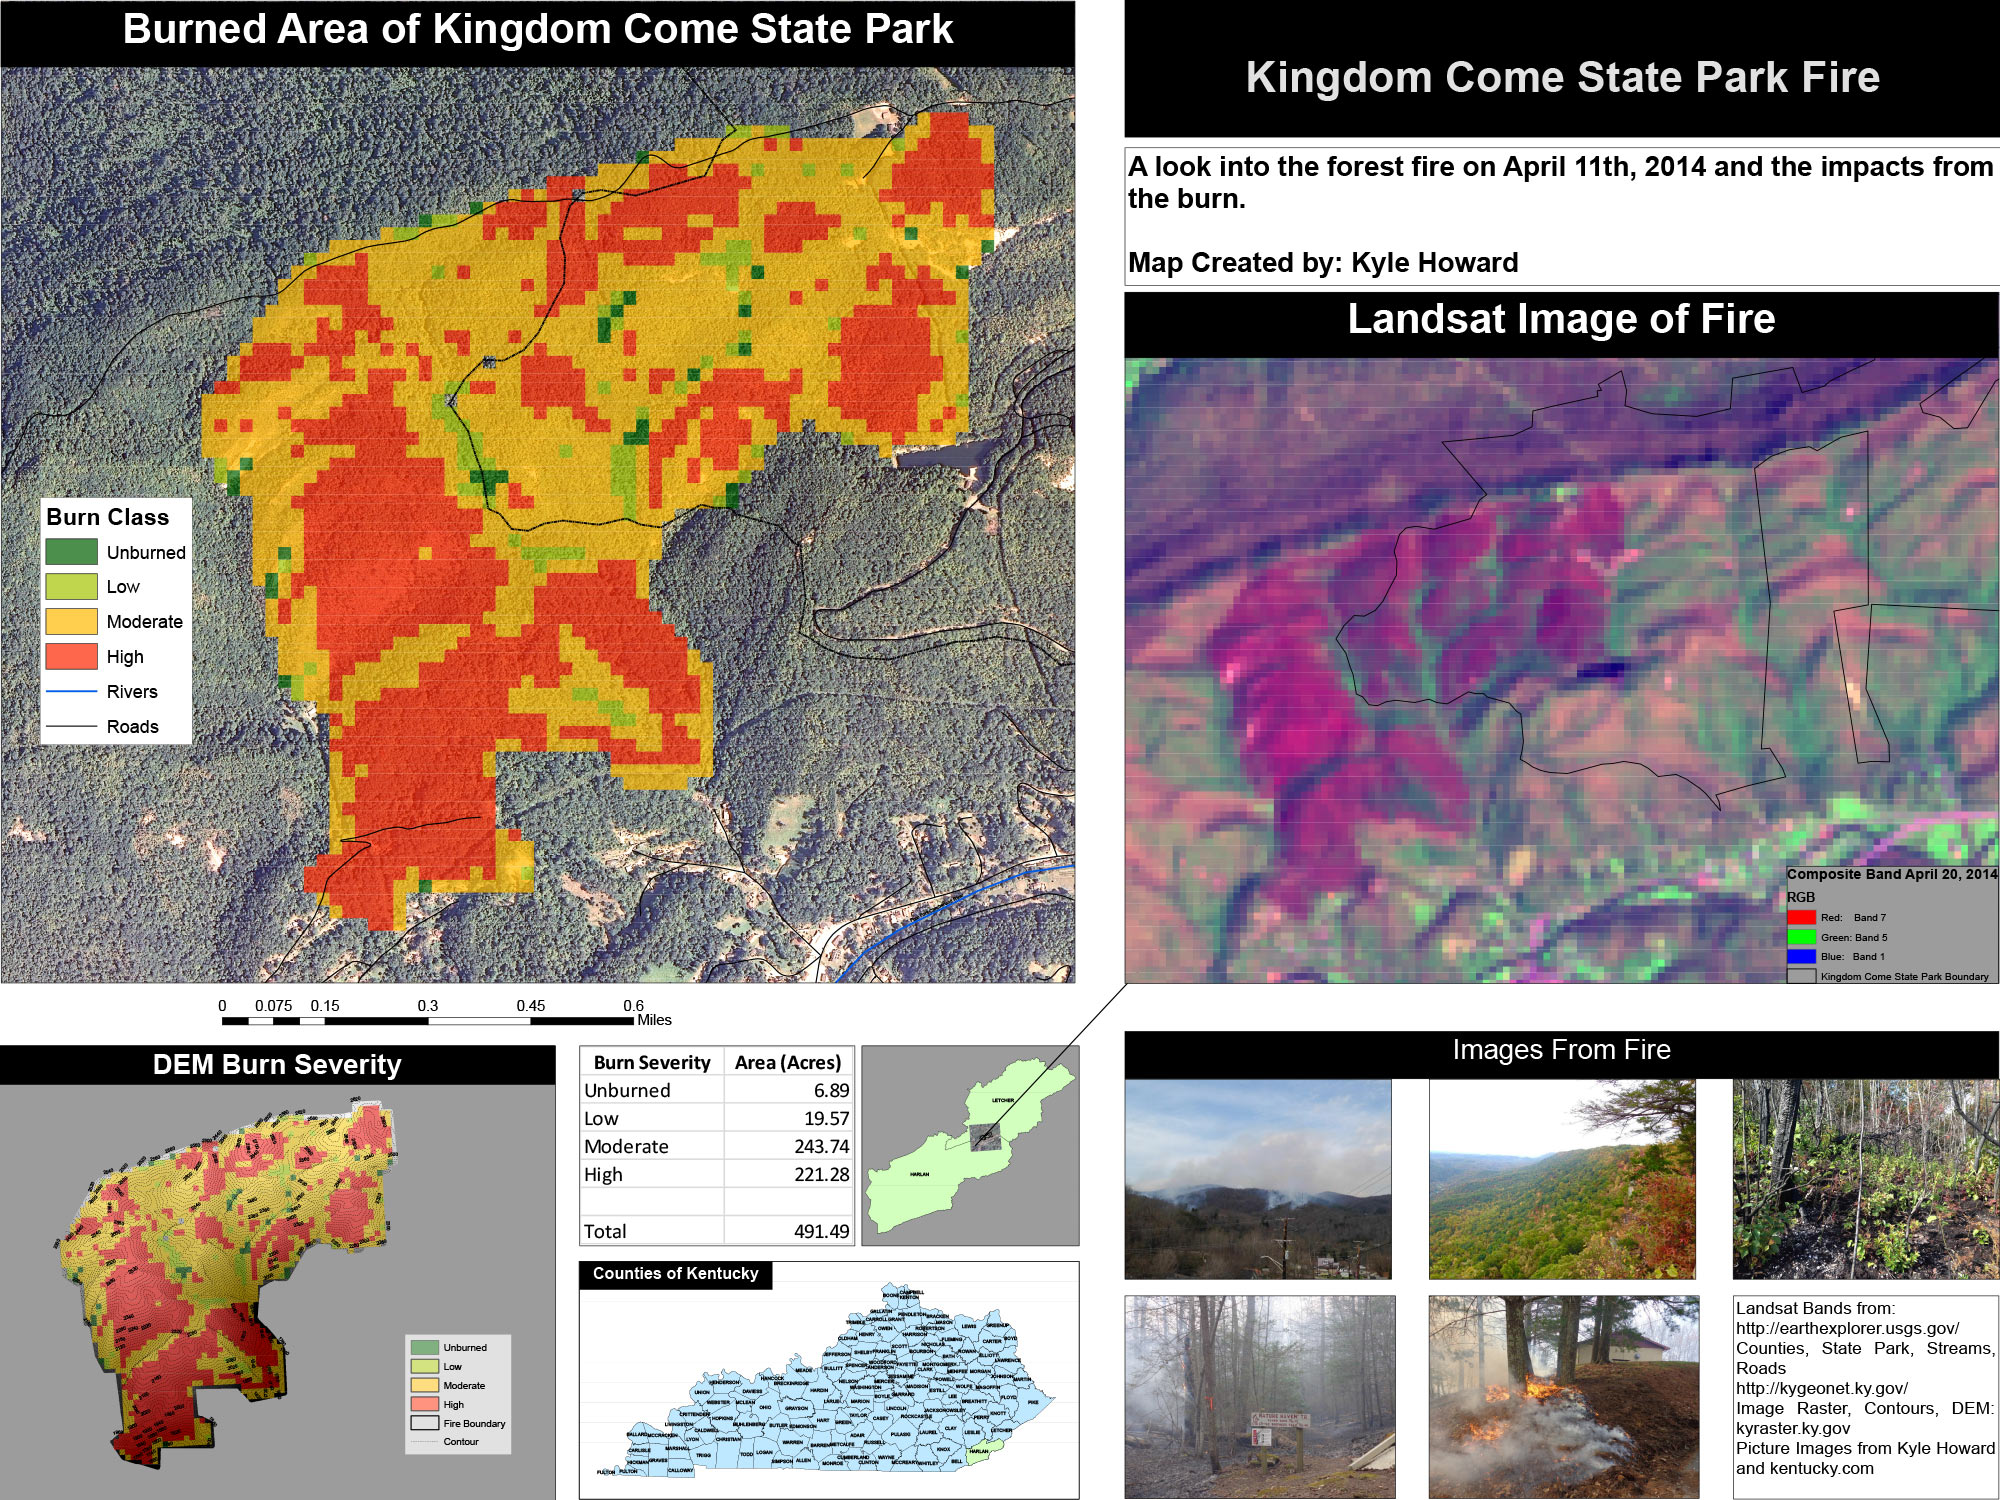
Mapping Kentucky's Wildland Fires with Satellite Imagery, November, 2014
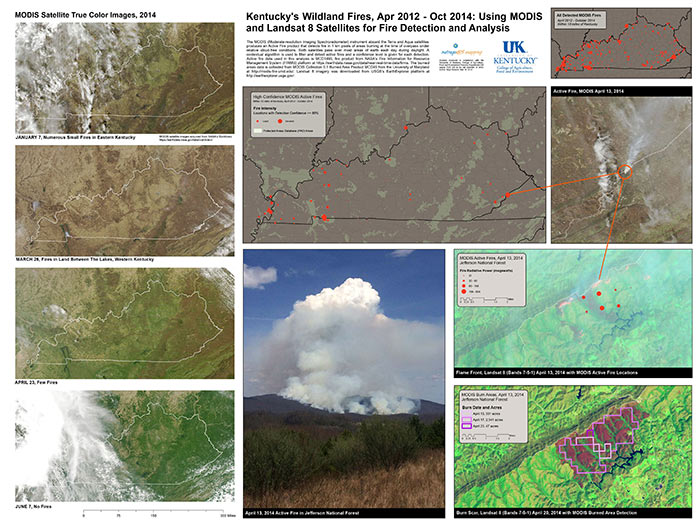

Kentucky has damaging wildland fires, while also using prescribed burns to manage habitat. An unfortunate statistic tells us that most wildland fires in Kentucky are from arson. This lab uses MODIS Active Fire Detection products and Landsat 8 near-infrared bands to locate and analyze the largest fires between April 2012 and October 2014.
Students map trees in UK's Arboretum, October, 2014
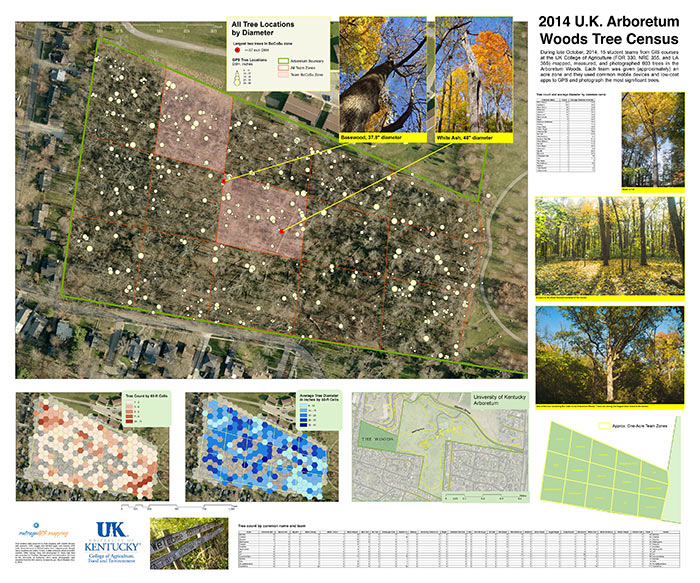

15 student teams from two GIS courses mapped, measured, and photographed 603 trees in the Arboretum Woods. Each team was given (approximately) an acre zone and they used common mobile devices and low-cost apps to GPS and photograph the most significant trees. Each team made a poster and presented them during a 2014 International GIS Day event. Since students photographed each tree, we made an interactive map that shows these photos and can be used for geolocation while in the woods. Look at trees now!
Hiking publication for the north half of the Daniel Boone National Forest
August, 2014

Four 19" x 27" maps show all official hiking trails in the north half of Kentucky's Daniel Boone NF. While focusing on the Sheltowee Trace, the publication shows popular destinations like the Red River Gorge and Cave Run Lake. The map includes 50-foot elevation contours, canopy cover, and GPS mapped trails at a scale of 1" to 1/2 mile. An exciting project has been launched to geocode and present a photograph for each mile of the Sheltowee Trace: http://www.SheltoweeTrace.com/hike
Visualizing University of Kentucky's Pedestrian Network
May, 2014
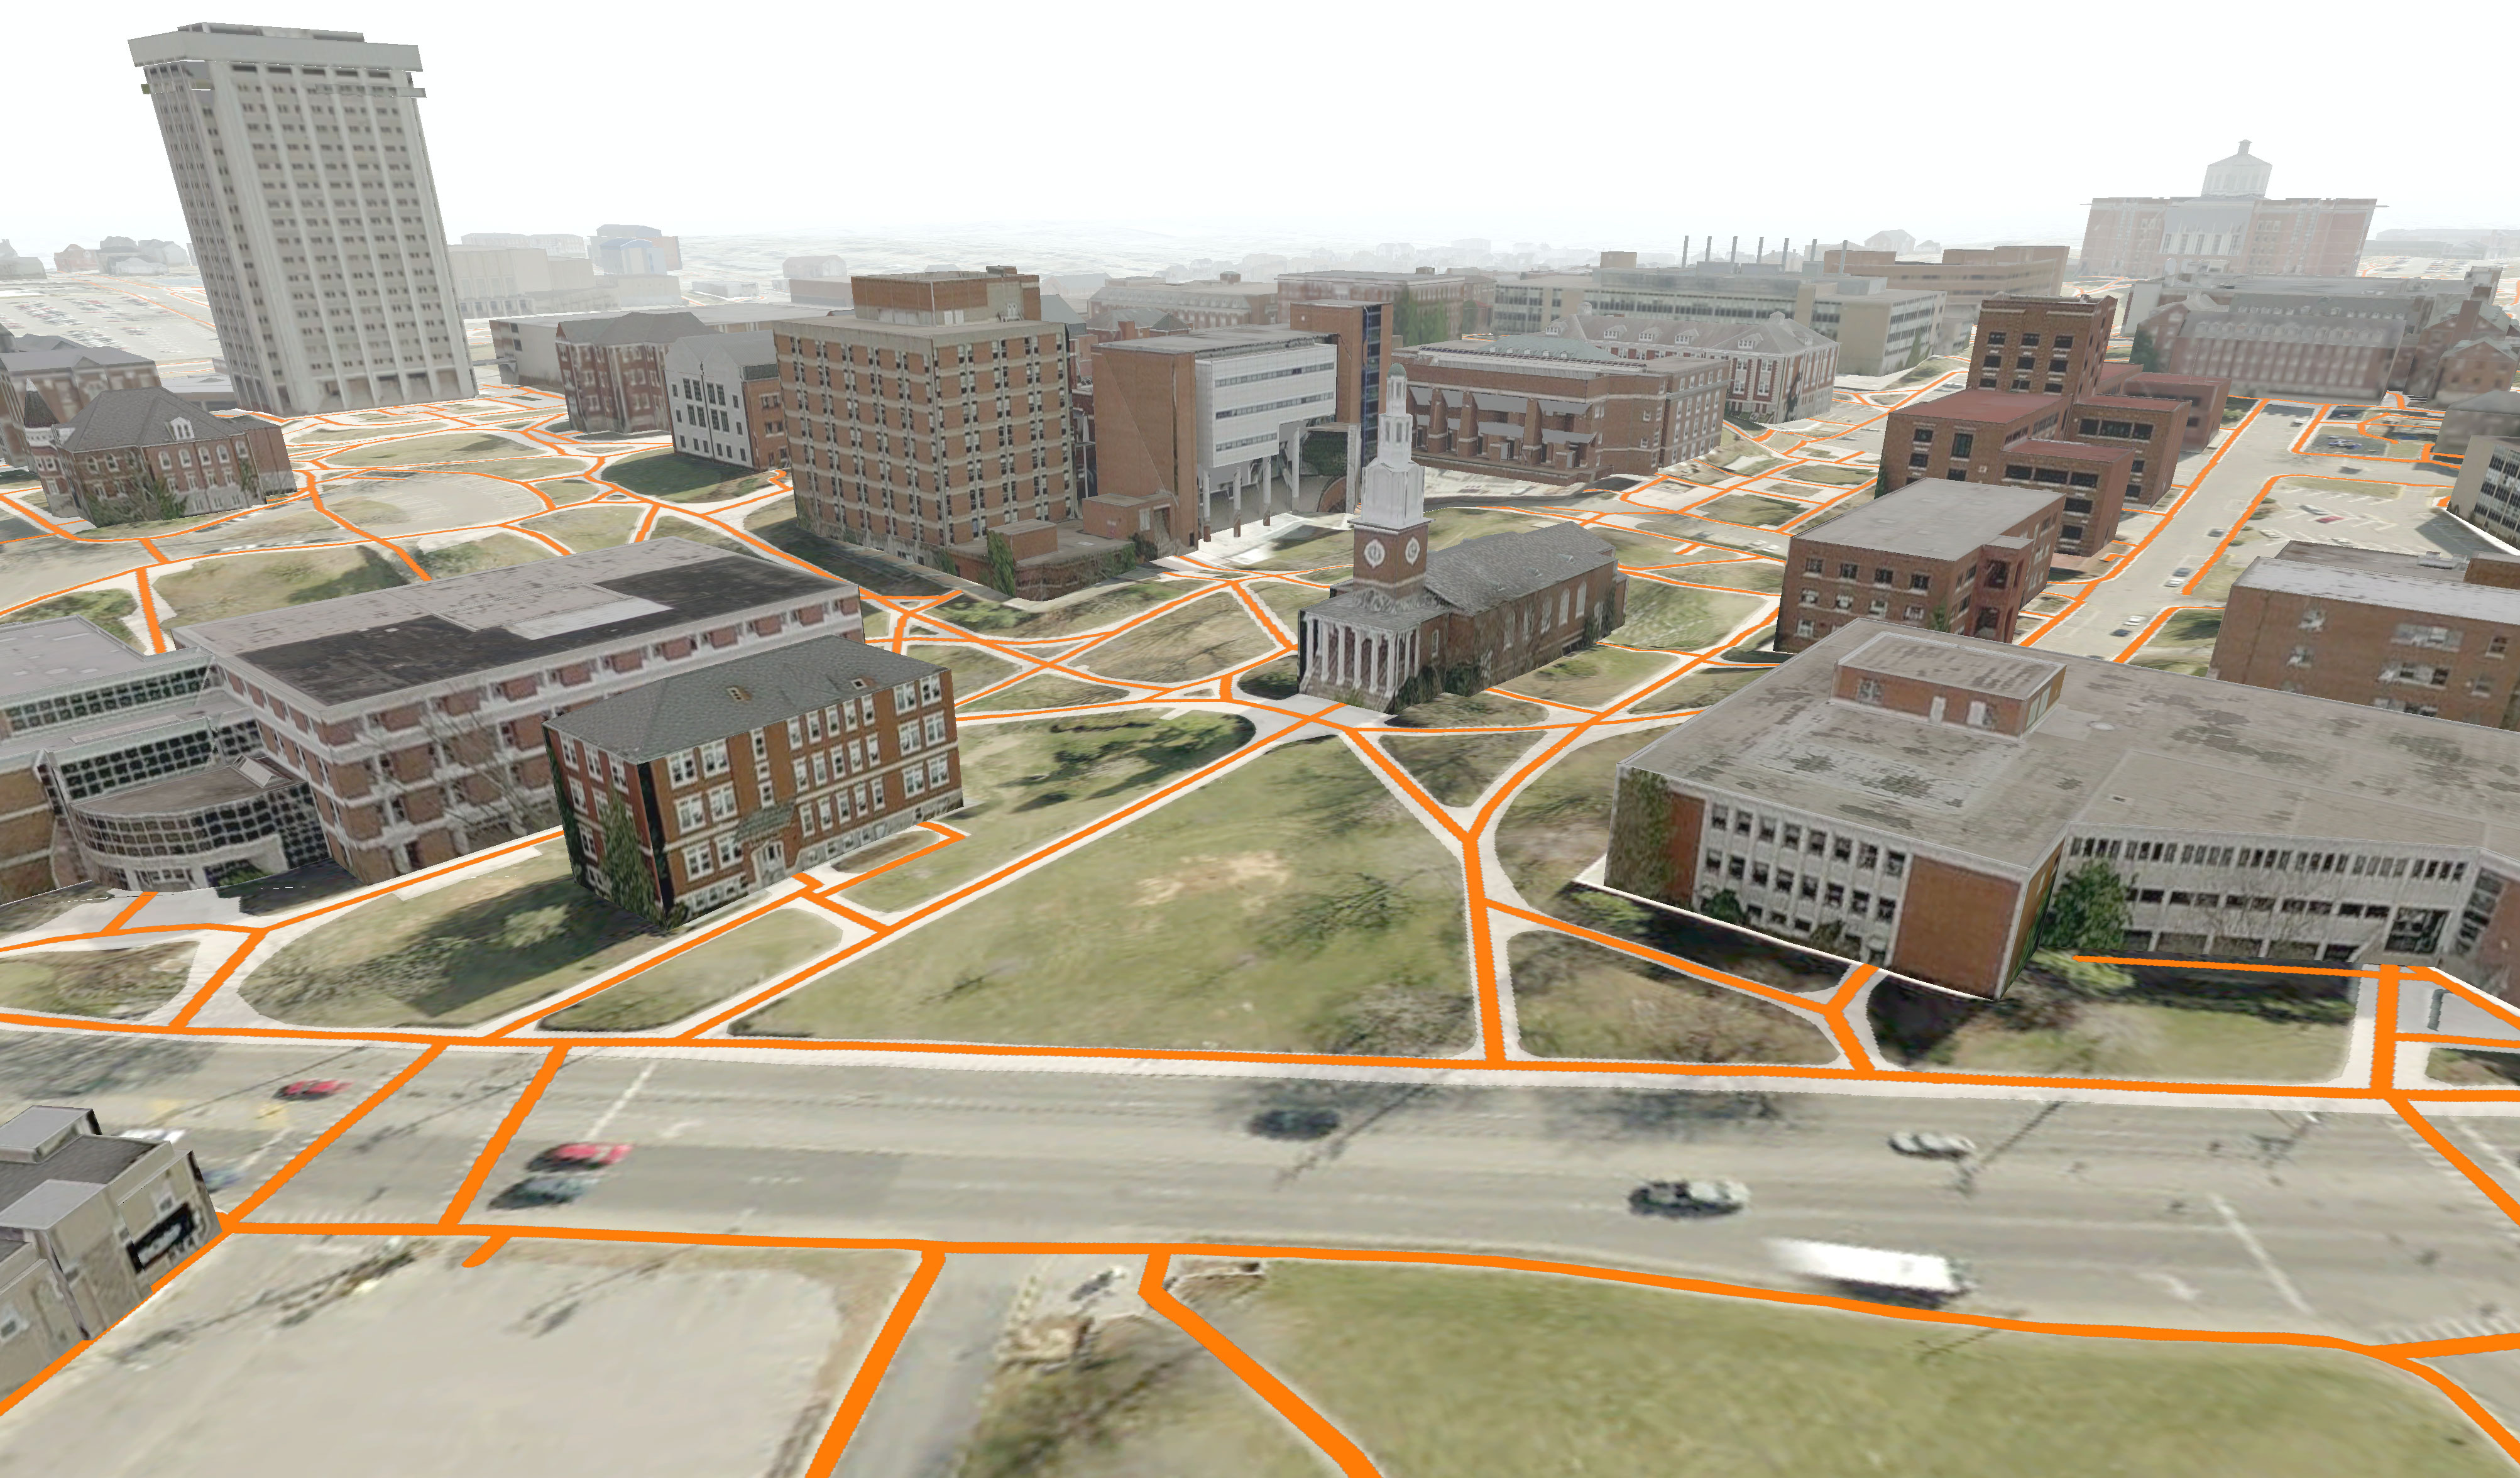
Modeling campus in ArcGlobe using the LiDAR elevation data and UK’s Facilities Information Services latest datasets.
Lexington Walkability Analysis
April, 2014
How close do you live to a pedestrian path?

A Pedshed is used to show how many people are connected by pedestrian paths and sidewalks with either a five-minute or fifteen-minute walk. Only roads with sidewalks are included in the analysis. It is assumed that people can walk faster on pedestrian paths (3.4 mph) than roads with sidewalks (2.8 mph). That's fast! For more casual walking, speeds are about half as fast.
Paved paths and sidewalks were attributed and digitized from 2010 aerial photography by students in University of Kentucky Department of Geography's GEO 409 course, Spring 2014. This analysis has a focus on existing access and potential future access (of various completed designs) of Lexington's two longest shared-use trails, the Legacy and Town Branch Trails.
How more connected would Lexington be if the Legacy Trail and Town Branch Trail were completed?
Analysis Results
Five-Minute Walk From All Existing Pedestrian Paths
Approximately 149,000 Fayette County residents (50%) live within a five-minute walk (on a sidewalk) of an existing paved pedestrian path, such as shared-use trail, park walking trail, and school walking path.
Fifteen-Minute Walk From Existing Town Branch & Legacy Trails
Approximately 11,500 Fayette County residents (approximately 3.8%) live within a fifteen-minute walk (on a sidewalk) of existing Town Branch Trail and Legacy Trail facilities. View a dynamic map of this scenario here.
Fifteen-Minute Walk From Completed Town Branch Trail Phase III Without Bridge Across Town Branch
Approximately 12,800 Fayette County residents (4.3%) would live within a fifteen-minute walk (on a sidewalk) of Phase III of Town Branch Trail and Legacy Trail facilities. This option does not include a bridge across Town Branch.
Fifteen-Minute Walk From Potential Future Town Branch & Legacy Trails (with bridge across Town Branch)
Approximately 38,900 Fayette County residents (12.5%) would live within a fifteen-minute walk (on a sidewalk) of finished Town Branch Trail and Legacy Trail facilities. View a dynamic map of this scenario here.
Lexington's Population Served by Bike Lanes
In 2010, the Census Bureau reported that 295,803 people lived in Fayette County, Kentucky. In November, 2012, the city had 28.8 miles of existing bike lanes. This analysis attempts to calculate the number of people in Fayette County living close to bike lanes.
45.8% of Fayette County's population lives within 0.5 miles of a bike lane.
Pedestrian V Car Collision Analysis
Fayette & Jefferson Counties, February, 2014.
Point locations for collisions were downloaded from the Kentucky Collision Analysis for the Public (http://crashinformationky.org/) hosted by the Kentucky State Police. Analysis was performed for Kentucky's Fayette and Jefferson Counties for data period January 5, 2003 - February 23, 2014 as part of GEO 409, Spring 2014. An ArcGIS ModelBuilder and Python script was created to automate geoprocessing of data and map generation.
Louisville Statistics
- AMONG ALL COLLISIONS 4,592 pedestrians v. car collisions occurred with 173 pedestrian fatalities (3.8% of total) and 4223 pedestrian injuries (92% of total).
- AMONG ALL COLLISIONS WITH PEDESTRIANS USING ALCOHOL OR DRUGS 257 pedestrians v. car collisions occurred with 26 pedestrian fatalities (10%) and 227 pedestrian injuries (88% of total).
- Rate: 6.1 collisions per 1,000 current residents
- Download Map
Lexington Statistics
- AMONG ALL COLLISIONS 1,689 pedestrians v. car collisions occurred with 47 pedestrian fatalities (2.9% of total) and 1580 pedestrian injuries (94% of total).
- AMONG ALL COLLISIONS WITH PEDESTRIANS USING ALCOHOL OR DRUGS 130 pedestrians v. car collisions occurred with 9 pedestrian fatalities (6.9%) and 118 pedestrian injuries (91%).
- Rate: 5.5 collisions per 1,000 current residents
- Download Map
Scenic Landscape Index
Fayette County, November, 2013.
Summary: This Scenic Landscape Index favors more natural settings such as rural areas, forests, stream valleys, larger public parks, and areas of high relief. National Register of Historic Properties are included and while most properties were small and located in the urban core, larger properties with tree canopy scored a relatively high value in the index; Ashland and the Lexington Cemetery are examples. Locations in southern Fayette County scored the highest values because of their proximity to the forested cliffs of the Kentucky River Palisades. Neighboring river tributaries, such as Boone Creek and Elk Lick, extend high scenic values northward. The area with highest contiguous value is Raven Run Park, primarily because it is publicly accessible, though unfortunately not during the time one might watch a sunrise or sunset. Notable scenic corridors are found along Town Branch, and the North and South Forks of Elkhorn Creek. Because the data used to calculate this index is from 2001 and 1998, some areas that score a high value, e.g. Hamburg area, have since been altered and would score lower values as the density of the built environment increased.
Methodology: Scenic conditions were converted to raster datasets and assessed an integer value based on a location's proximity to tree canopy, water, historic areas, parks, scenic roads, and the probability of seeing a sunrise or sunset at that location. Those conditions are shown in the Fayette County maps found at the bottom of this page. A location is defined as a 5-foot resolution raster cell. Using Map Algebra, all raster datasets were overlaid to find which locations had the greatest number of scenic conditions. The resulting map provides a relative scenic landscape index. Locations with higher values in the index have more scenic conditions. For example, areas with the highest values offer the best chance to see a sunrise or sunset in a natural setting of forested parks, historic areas, or rural places with ponds or lakes. Areas with the lowest values are primarily dense urban environments without tree canopy cover, parks, historic areas, or ponds.
Analysis created by Boyd Shearer, November, 2013 for the University of Kentucky GIS courses GEO 309, NRE 355, and LA 855. Data acquired from Lexington Open Data Portal (link), Kentucky Aerial Photography and Elevation Data Program (KYAPED) 5-foot Digital Elevation Model (link), and U.S. Geological Survey (USGS) National Land Cover Database 2001 land cover layer (link). Maps and analysis created in ESRI ArcMap 10.1.
Views of Sunsets and Sunrises is an index of areas to view sunsets and sunrises on the solstices, assuming one has a clear view of the sun at 8 degrees above the horizon on these two days. Areas that had the most likely view of a sunset or sunrise were awarded more value than areas with a less likely view. Proximity to Tree Canopy and Water is an index of areas that are under tree canopy or on a waterbody (greater than a 1/4 acre), or within 200 feet of either. Any of these conditions awarded equal value in the index. Tree canopy derived from 1998 aerial photography. Parks, National Register of Historic Properties, and Scenic Roads is an index of areas that were state parks or passive natural setting parks were awarded higher value in the index. Community parks, publicly accessible national register properties, and areas within 500 feet of county designated scenic roads were awarded lower, but equal, value in the index. Densely Built Urban Environment is an index of areas with increasing density of built environment were awarded lower values in the index. Derived from the 2001 National Land Cover Database.
Bicycle vs. Car Crash Analysis
Lexington, Kentucky. October 15, 2008 - October 14, 2013.
A 5-year analysis of bicycle accidents reported by Kentucky law enforcement agencies in Fayette County.
Within Fayette County, 396 bicycle and motor vehicle collisions were reported with 293 injuries and 3 fatalities. The average age of the cyclist was 29 years, 76% were male, and only 25% were wearing a helmet. 21% of the collisions were hit-and-run. The greatest rate, or density, of crashes centers on UK's campus. The next highest density was downtown, followed by small increases in crashes near Harrodsburg and Waller Ave, Winchester Rd, and on Loudon Ave. Critical street segments in order of greatest number of crashes are: Limestone north of Virginia Ave, Euclid Ave east of Woodland Ave, Rose St between Euclid and Huguelet Dr, and Winchester Road near intersection with East Third St.
Of all workers (16 years and older) living in the Urban Service Area, only 0.94% say the actively bike commute to work. Within 0.5 miles of a bike lane or sharrow, the share of workers saying they bike commute rises to 1.7%. Also, 89% of bike commuters live within a half mile of a bike lane or sharrow. It is estimated that 25% of all reported accidents have happened on streets with a sharrow or bike lane.
Maps and analysis by Boyd Shearer for GEO 309, NRE 355, and LA 855, October 20, 2013. University of Kentucky. Data acquired from the Kentucky State Police's Kentucky Collision Analysis for the Public database (http://crashinformationky.org/) and the 2007-2011 American Community Survey 5-Year Estimates for Block Groups (http://www.census.gov/geo/maps-data/data/tiger-data.html).
Kentucky's Distressed Areas
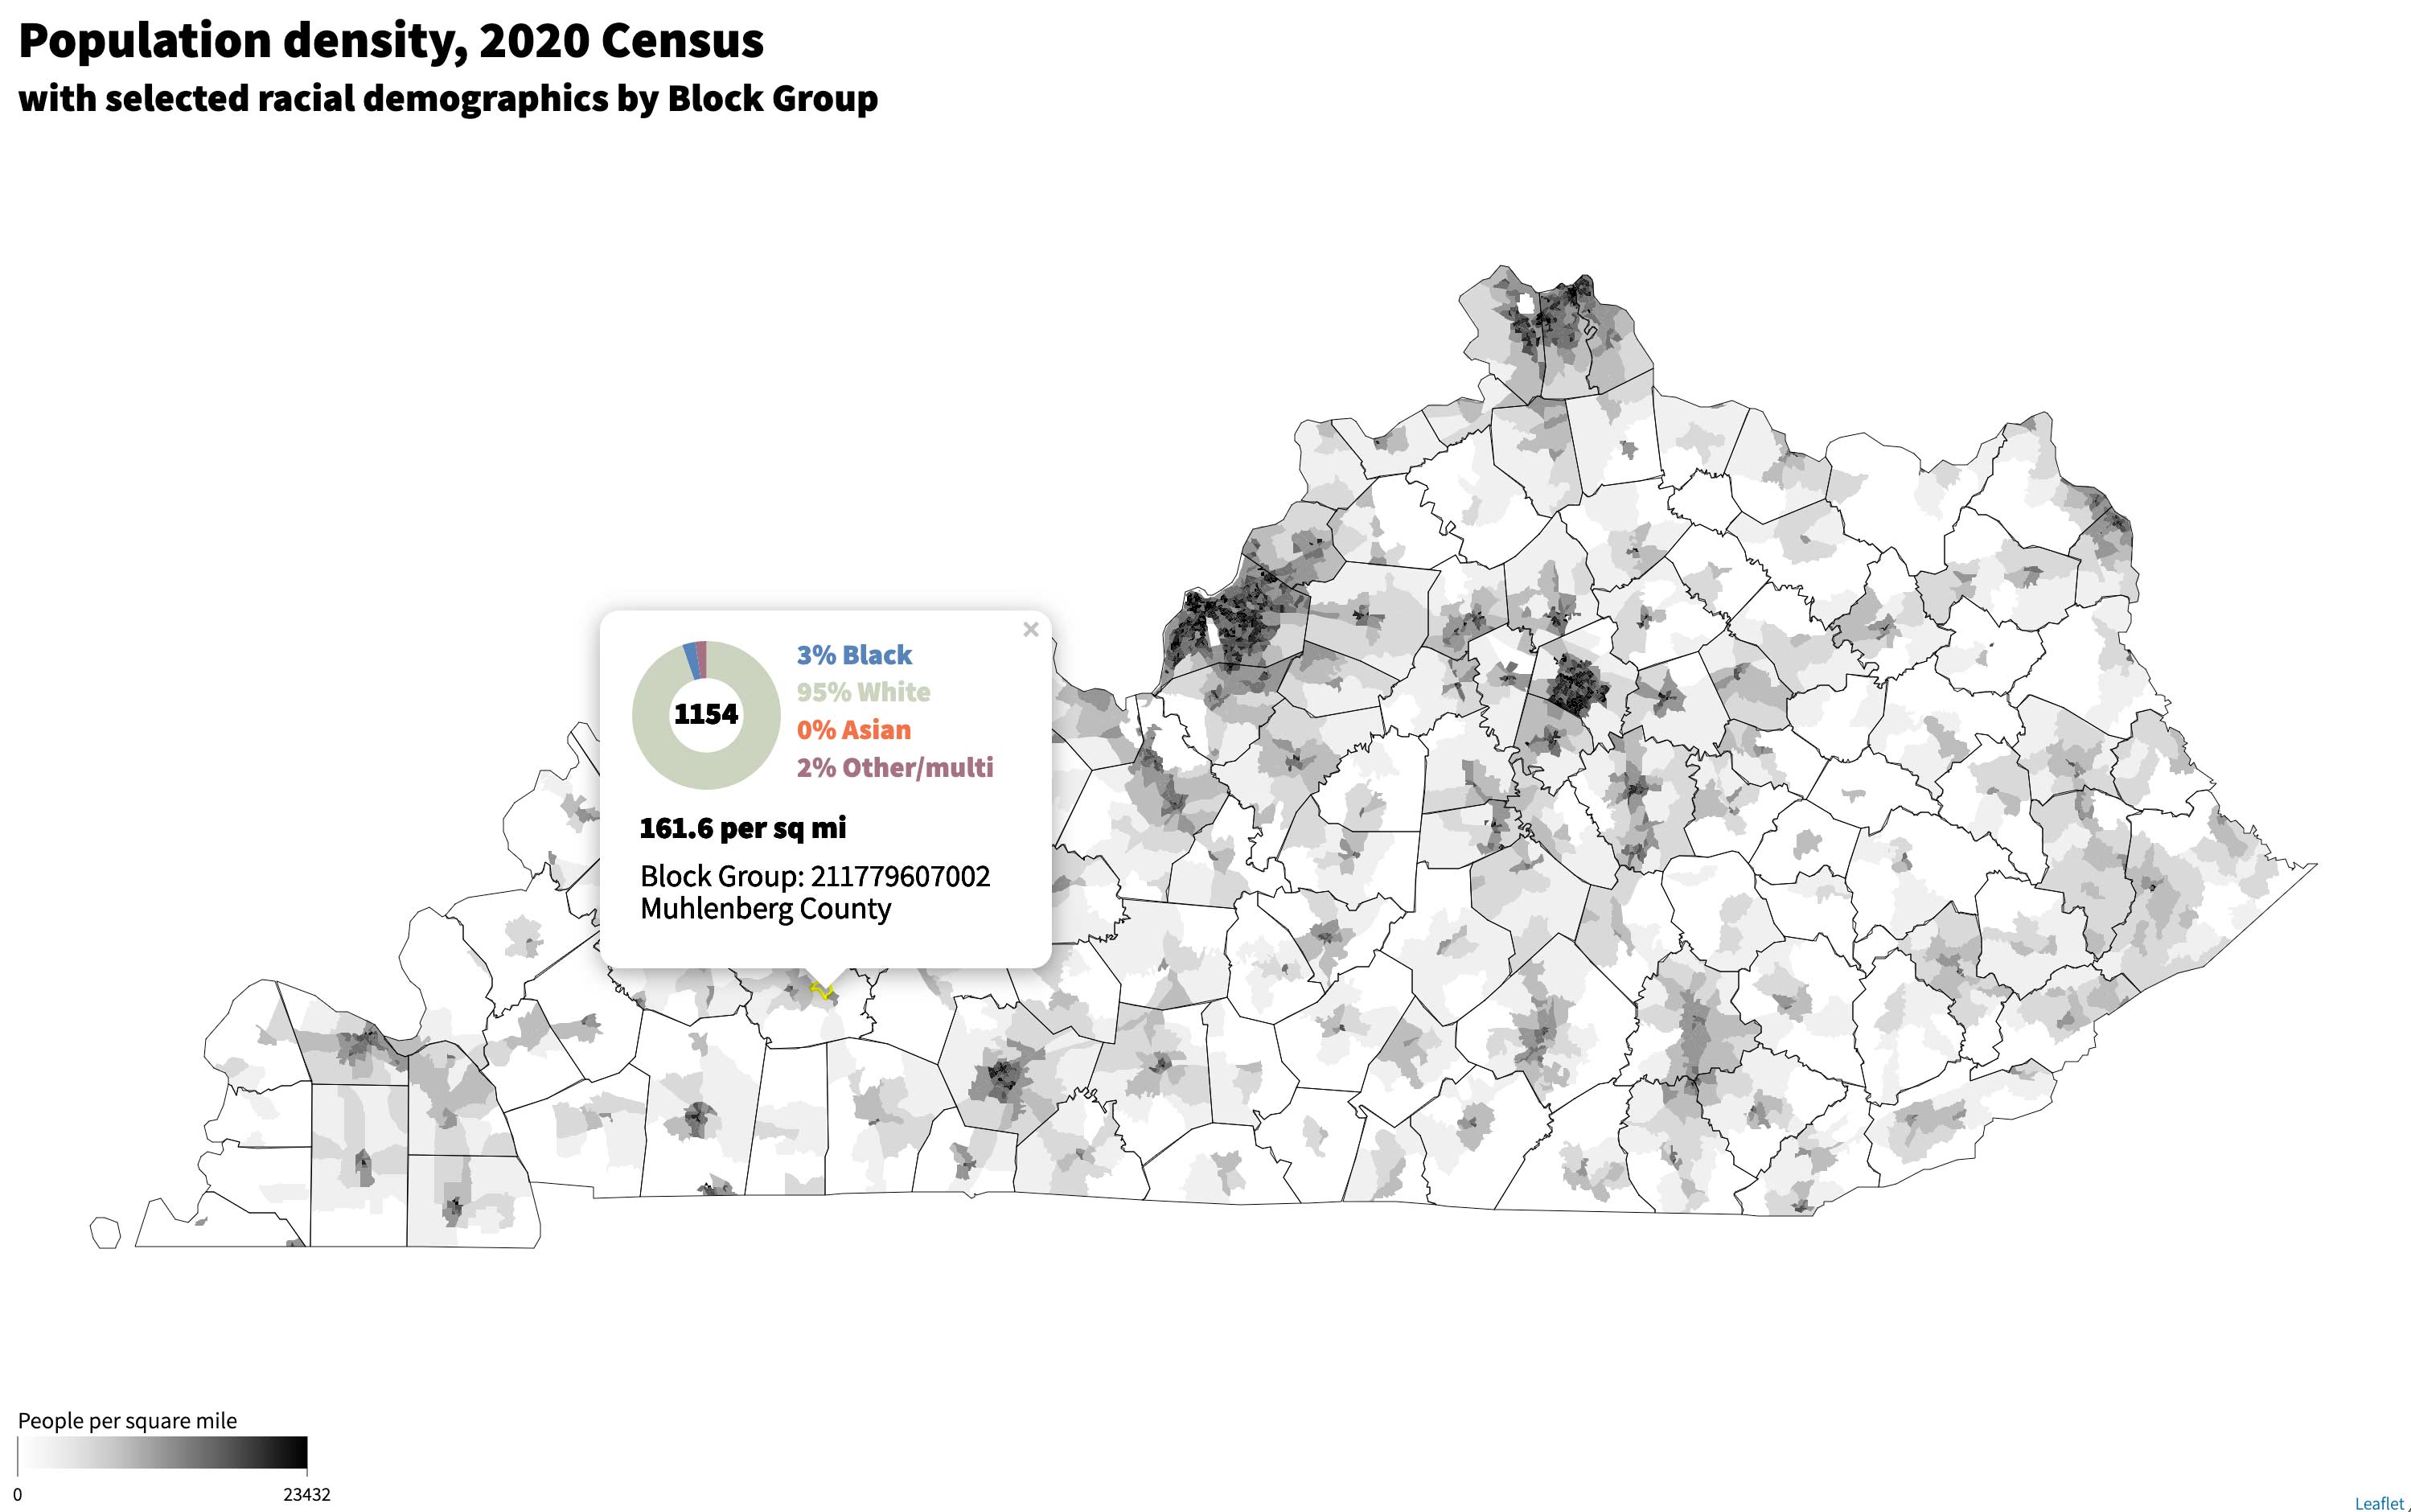
Socioeconomic and Environmental Distress by Block Group in Kentucky
Kentucky’s population is nearly balanced between urban and rural with 52% living in rural census block groups. Economic and social distress is more likely to occur in rural areas. 61% of Kentucky’s distressed population lives in rural areas and the majority of those areas have surface coal mining permits. More detail...
Kentucky’s population is nearly balanced between urban and rural with 52% living in rural census block groups. Economic and social distress is more likely to occur in rural areas. 61% of Kentucky’s distressed population lives in rural areas and the majority of those areas have surface coal mining permits. More detail...

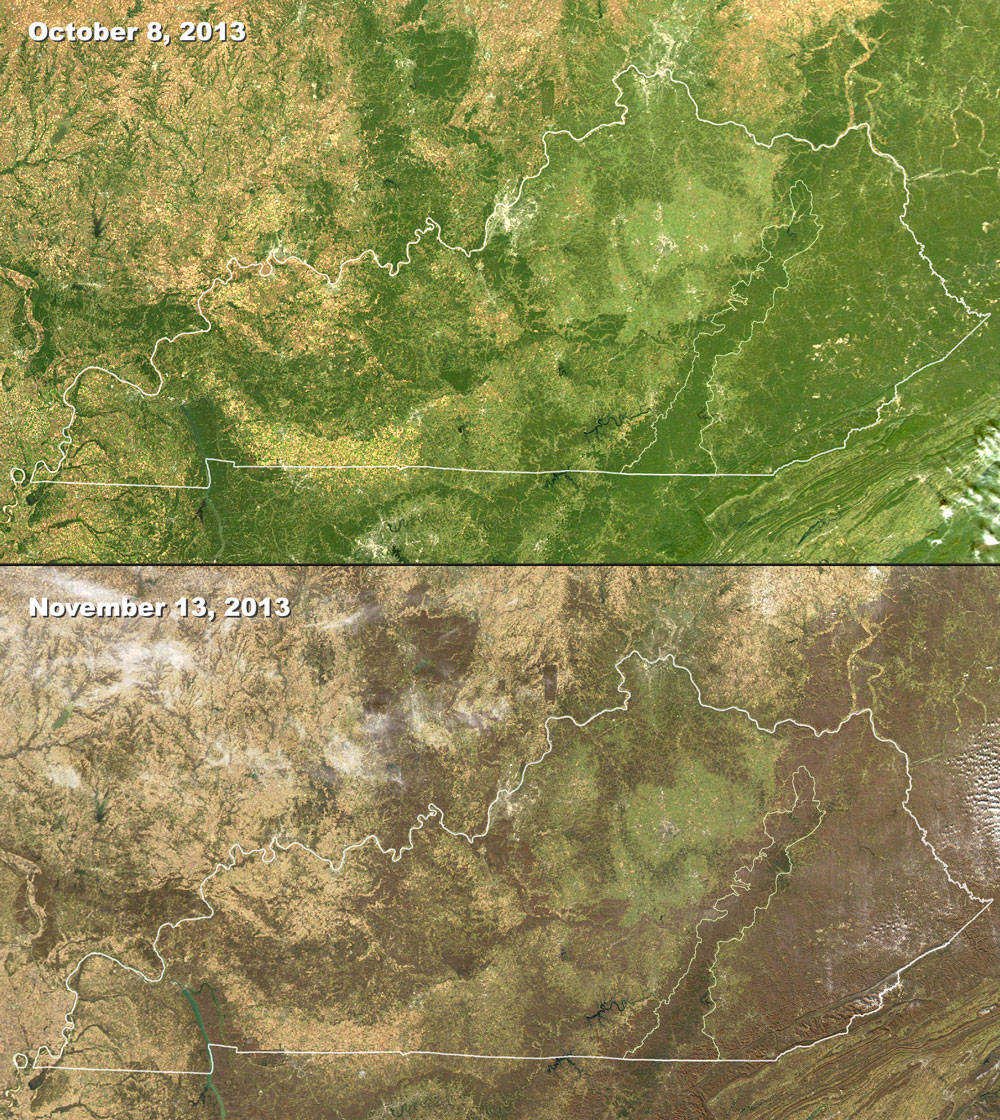
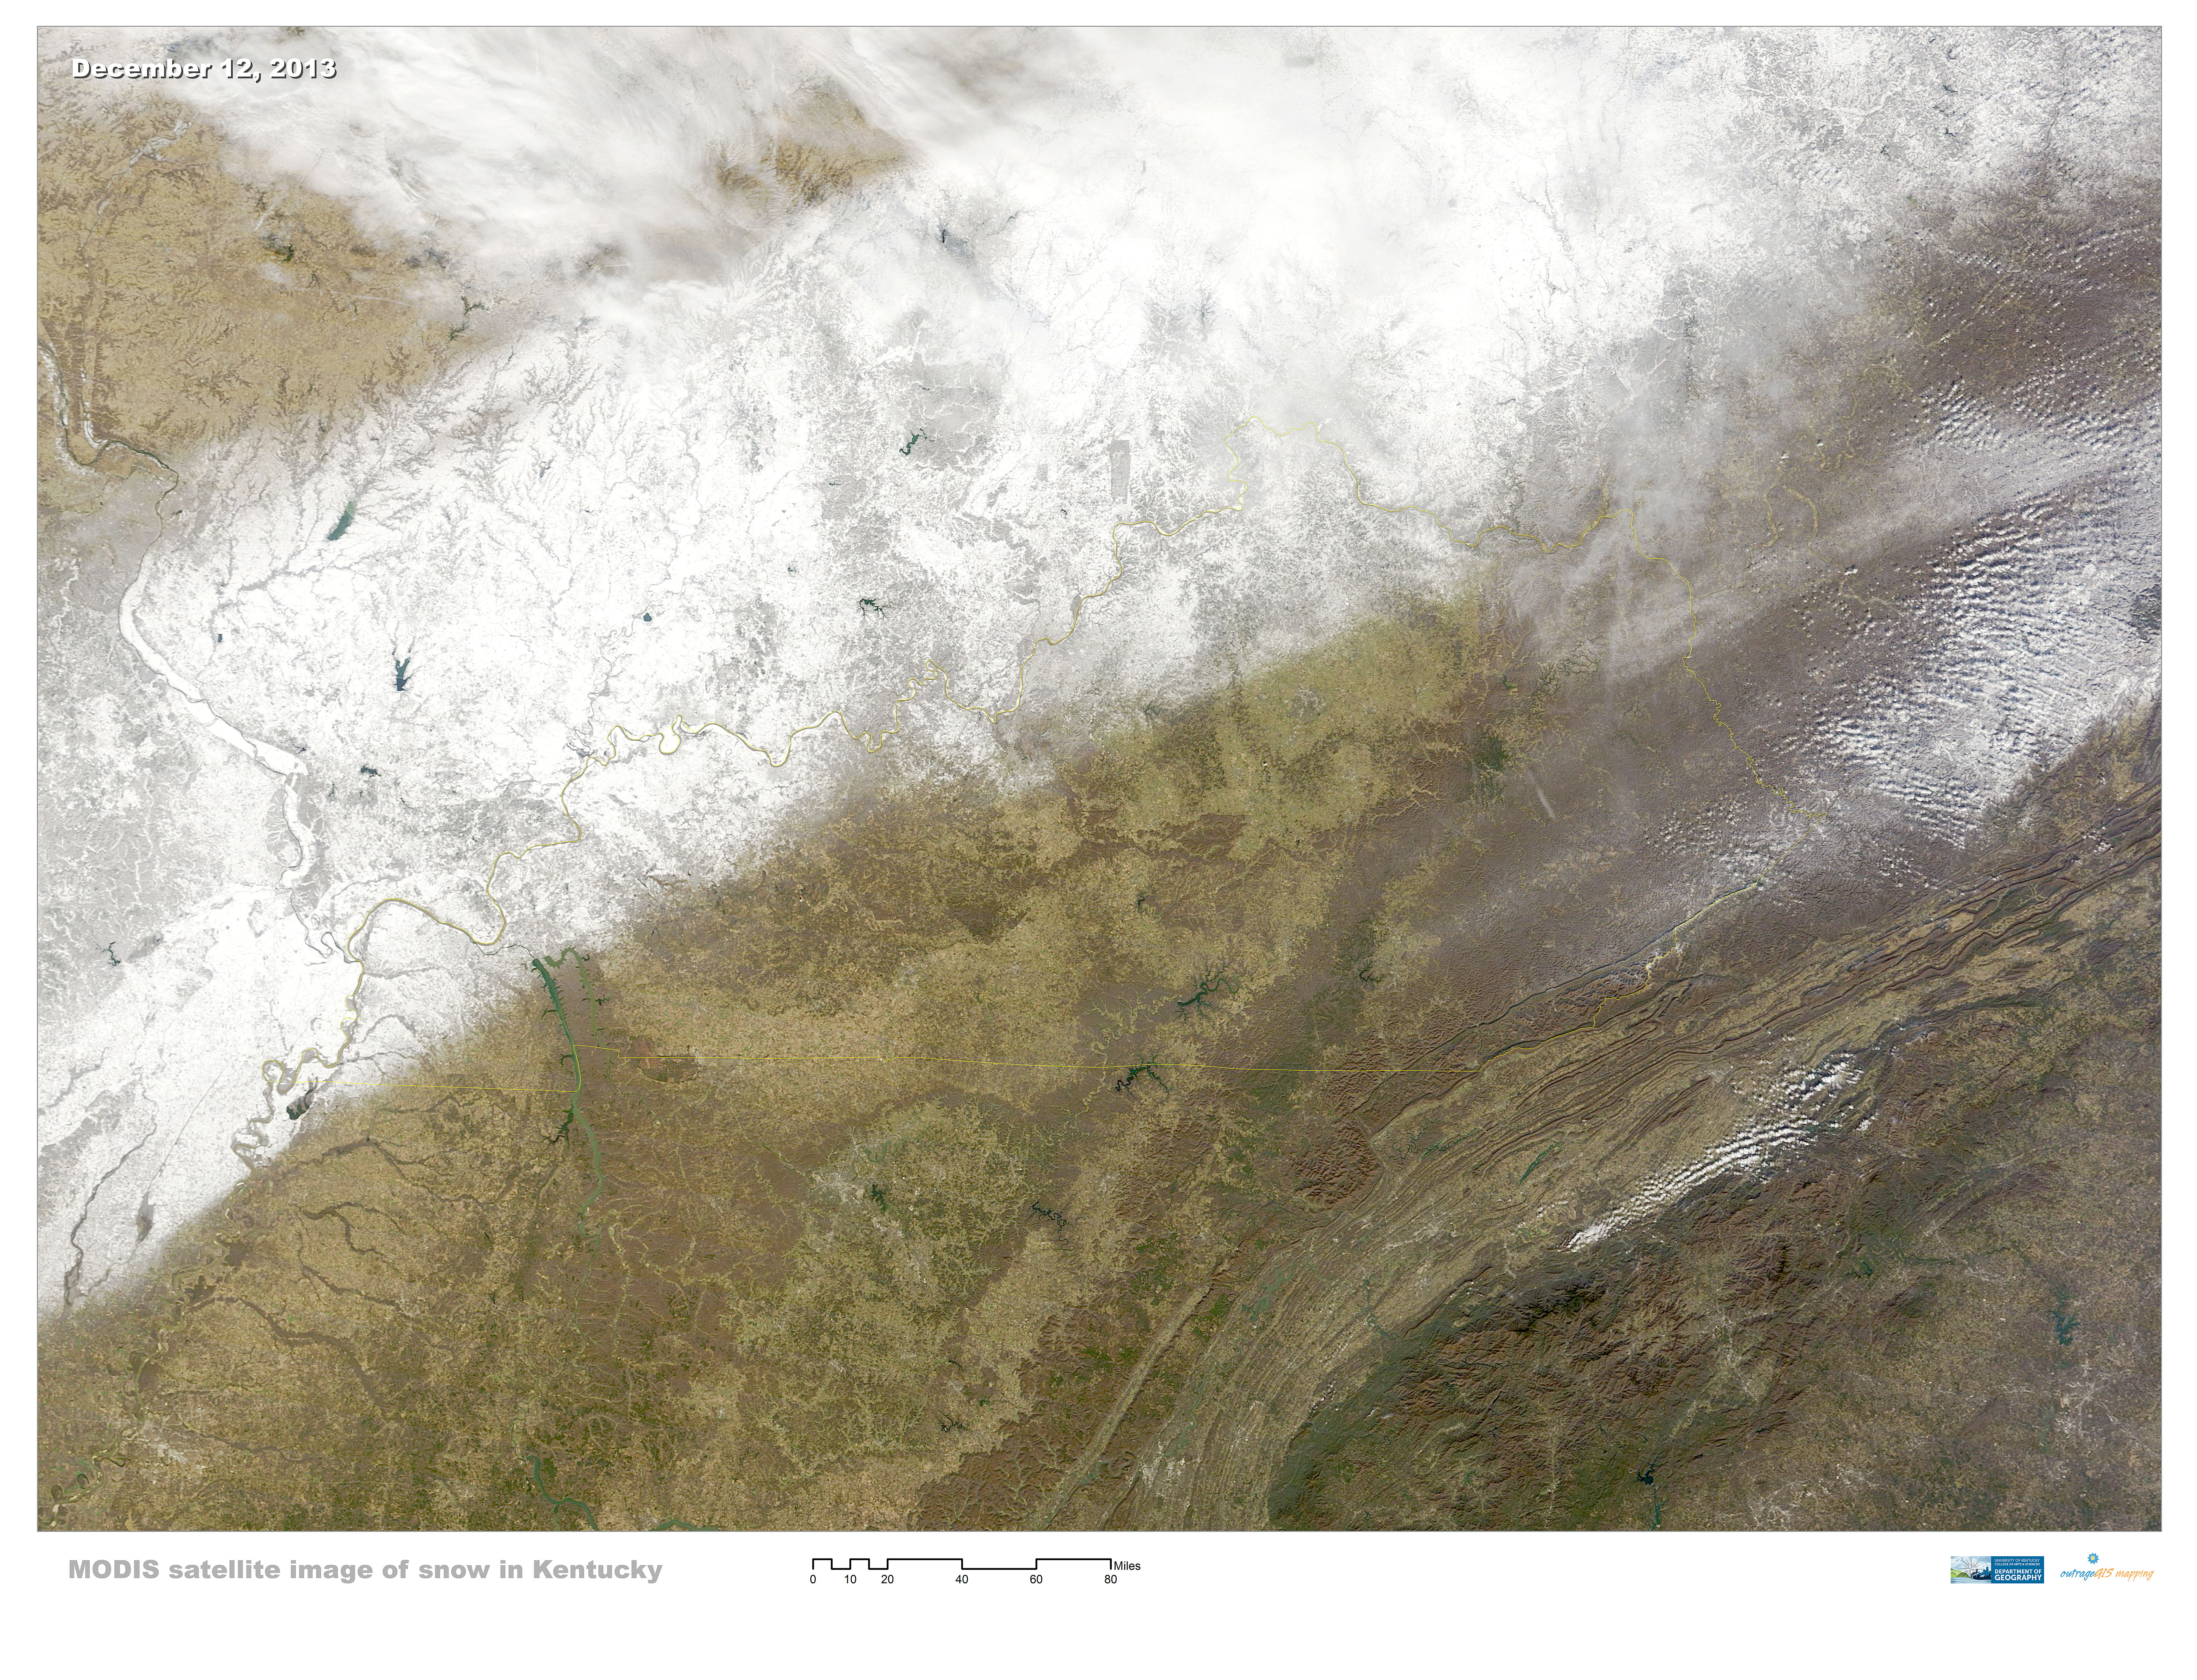
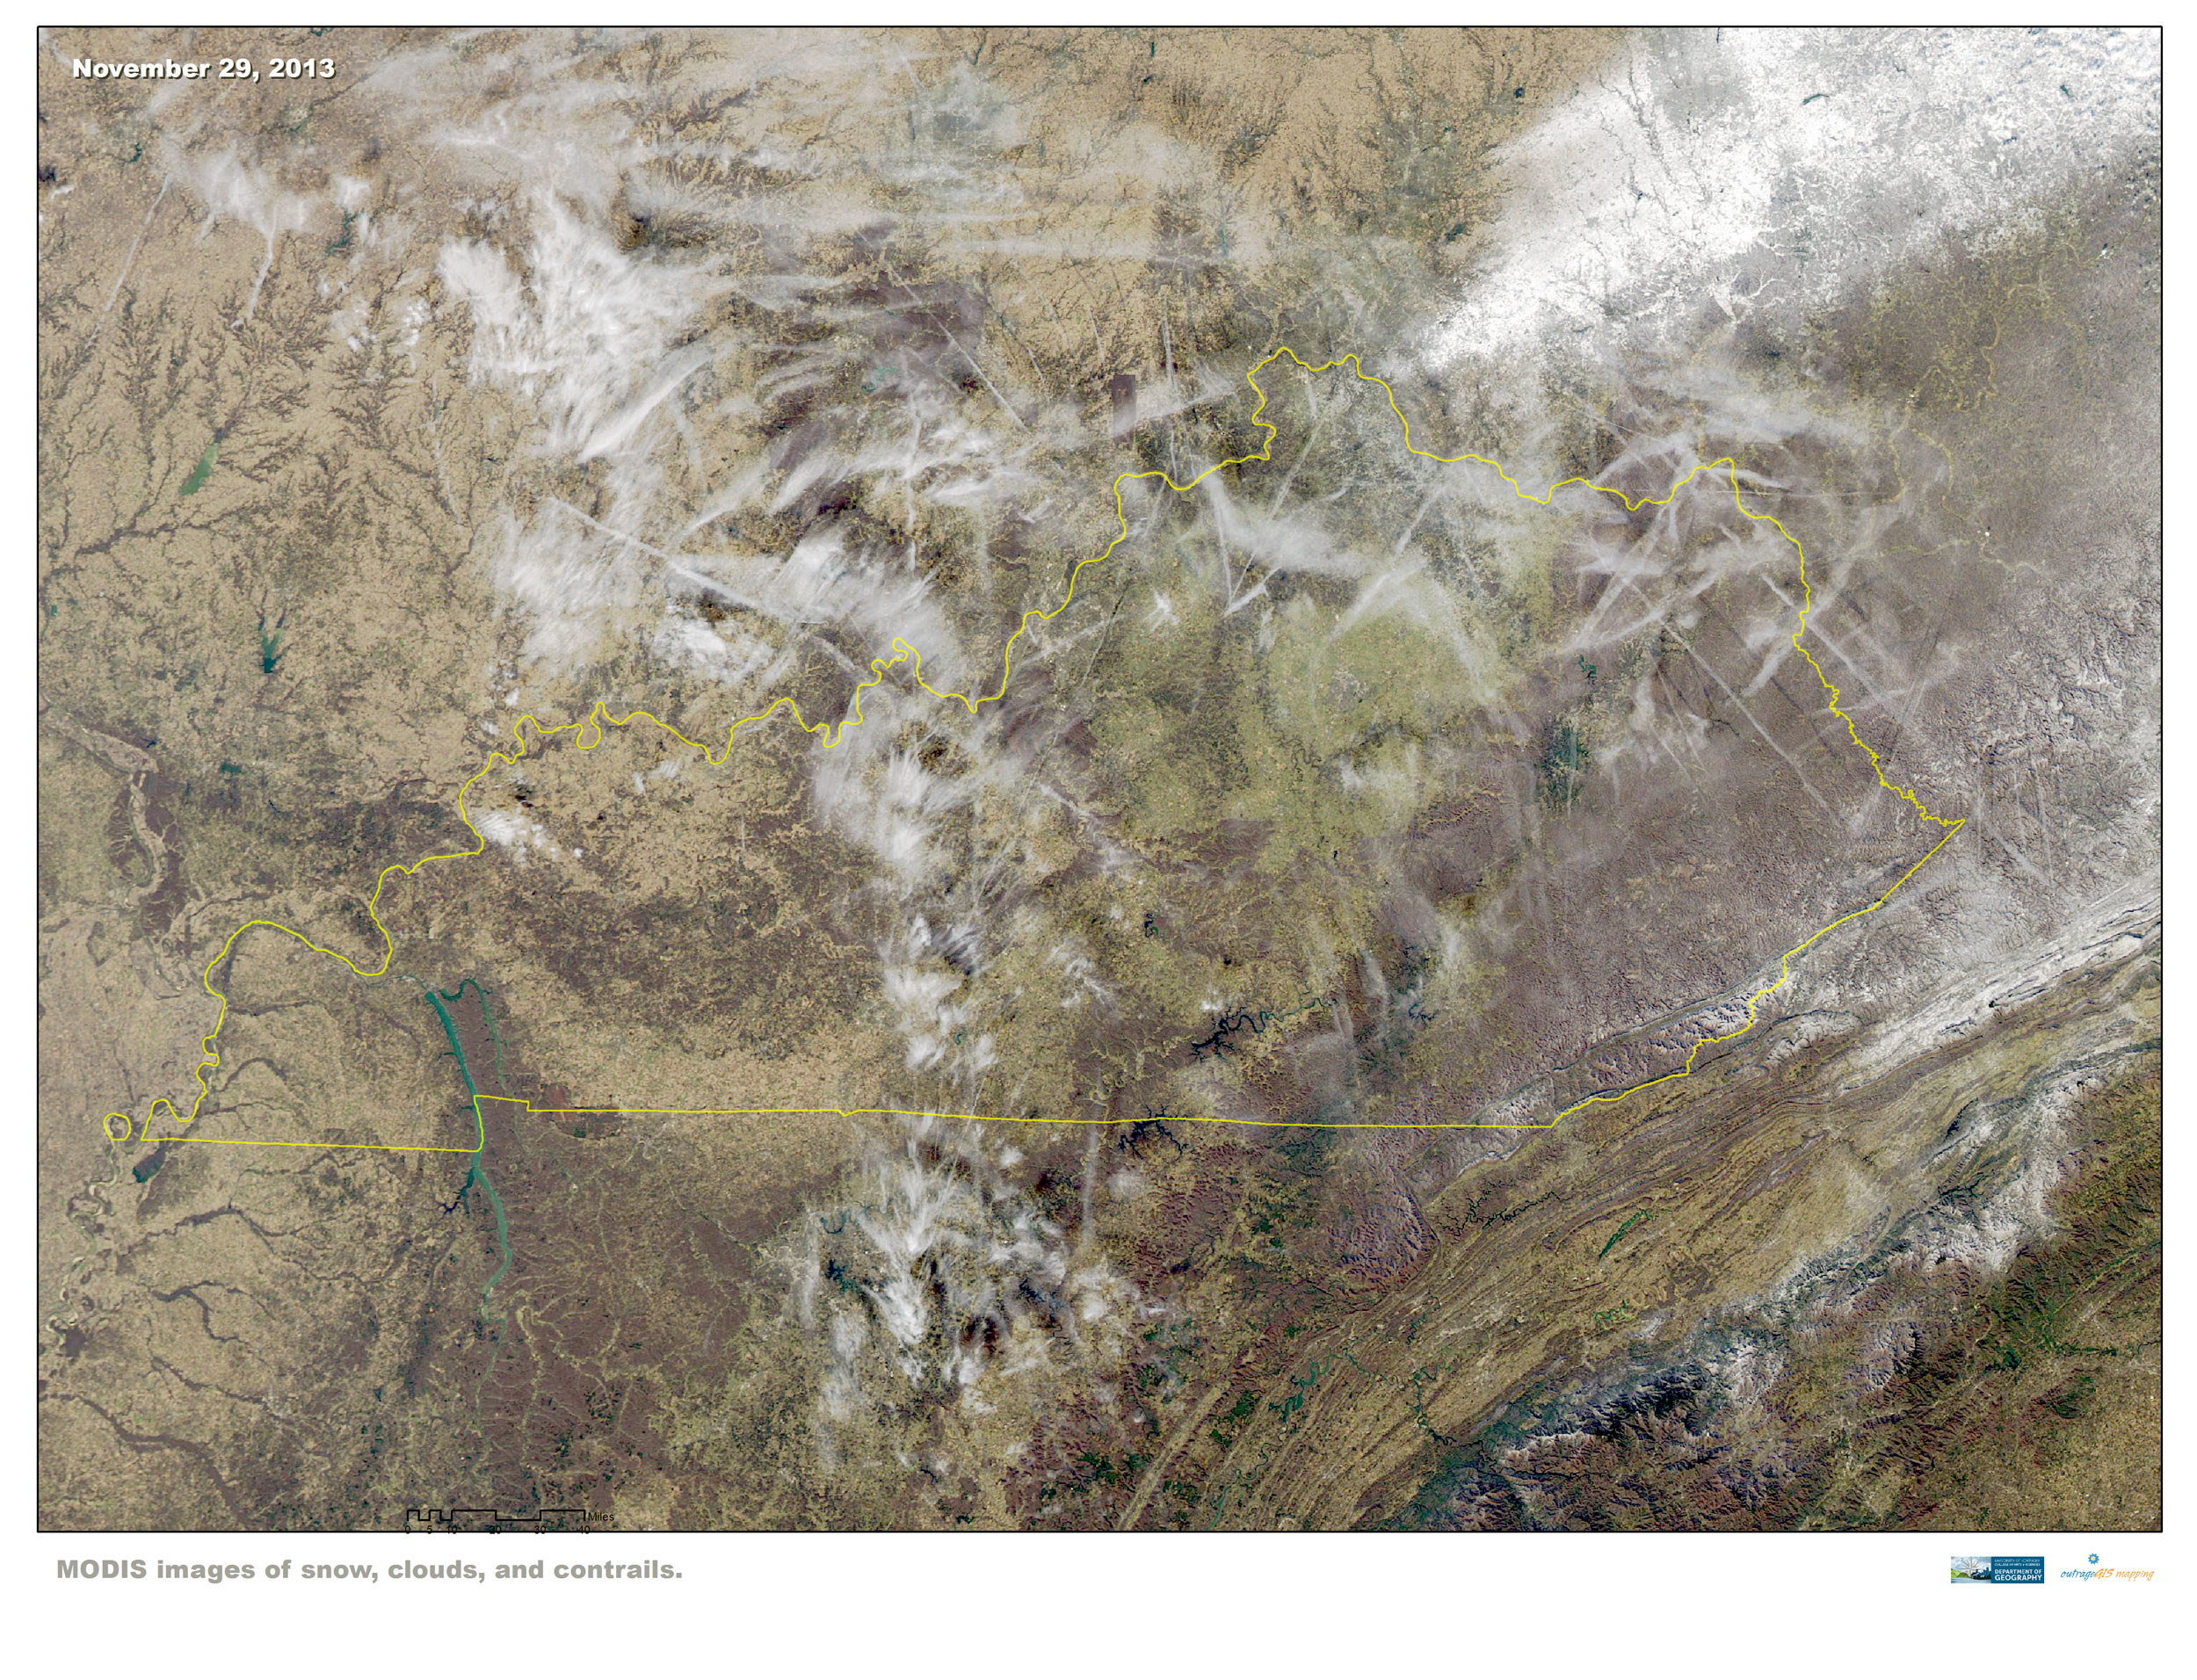
Explorations of MODIS satellite imagery
Kentucky transitions to fall
MODIS images, October 8 and November 13, 2013.
December Snow in Kentucky
MODIS December 12, 2013.
Snow, Land, and Clouds
MODIS December 10, 2013.

Snow, Clouds, and Contrails
MODIS November 29, 2013.
Kentucky transitions to fall
MODIS images, October 8 and November 13, 2013.

- Senior Lecturer
- Geography
- New Maps Plus
- New Mappings Collaboratory
POT 805A
Other Affiliations:
- UK Natural Resources and Environmental Science
- University of Kentucky Appalachian Center
